340 W Clark St Upland, CA 91784
Estimated Value: $1,682,000 - $1,922,000
4
Beds
4
Baths
4,505
Sq Ft
$400/Sq Ft
Est. Value
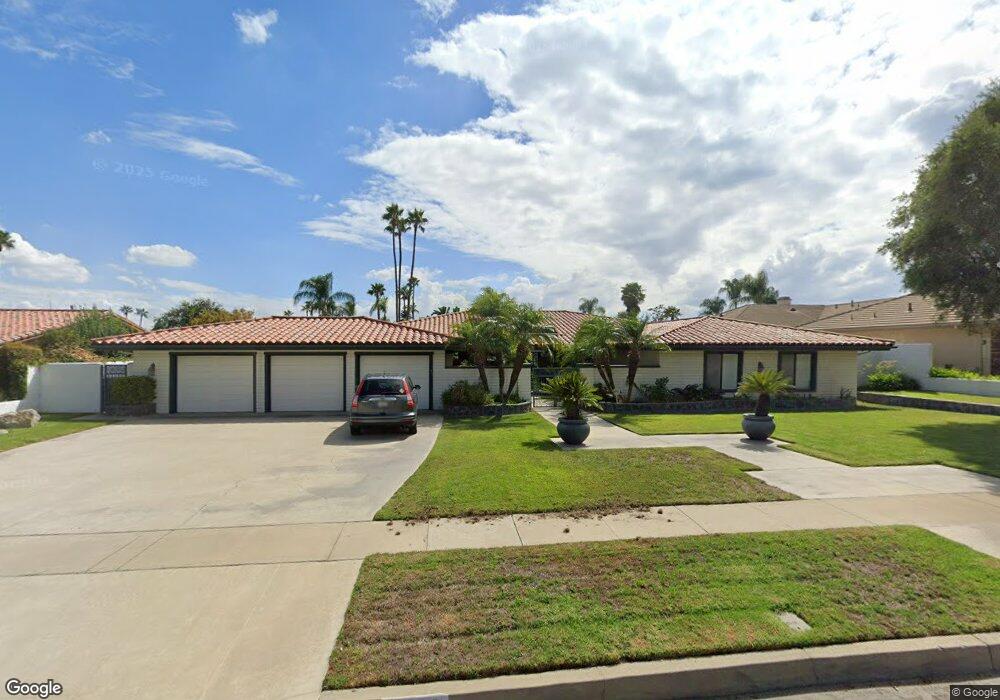
About This Home
This home is located at 340 W Clark St, Upland, CA 91784 and is currently estimated at $1,799,759, approximately $399 per square foot. 340 W Clark St is a home located in San Bernardino County with nearby schools including Magnolia Elementary, Pioneer Junior High School, and Upland High School.
Ownership History
Date
Name
Owned For
Owner Type
Purchase Details
Closed on
Apr 10, 2007
Sold by
Linder Edward
Bought by
Ross John J and Ross Nicki
Current Estimated Value
Purchase Details
Closed on
May 29, 2002
Sold by
Cendant Mobility Financial Services
Bought by
Linder Edward and Linder Janet
Home Financials for this Owner
Home Financials are based on the most recent Mortgage that was taken out on this home.
Original Mortgage
$560,000
Interest Rate
5.62%
Purchase Details
Closed on
Apr 12, 2002
Sold by
May William Michael
Bought by
Cendant Mobility Financial Corp
Home Financials for this Owner
Home Financials are based on the most recent Mortgage that was taken out on this home.
Original Mortgage
$560,000
Interest Rate
5.62%
Purchase Details
Closed on
Oct 14, 1998
Sold by
Patricia De Bonis Ted S
Bought by
May William Michael and May Shellie R
Home Financials for this Owner
Home Financials are based on the most recent Mortgage that was taken out on this home.
Original Mortgage
$450,000
Interest Rate
6.61%
Purchase Details
Closed on
Apr 19, 1994
Sold by
Debonis Ted S
Bought by
Debonis Ted S and Faubion Bill B
Create a Home Valuation Report for This Property
The Home Valuation Report is an in-depth analysis detailing your home's value as well as a comparison with similar homes in the area
Home Values in the Area
Average Home Value in this Area
Purchase History
| Date | Buyer | Sale Price | Title Company |
|---|---|---|---|
| Ross John J | $1,475,000 | Chicago Title Company | |
| Linder Edward | $750,000 | Equity Title | |
| Cendant Mobility Financial Corp | -- | Equity Title | |
| May William Michael | $625,000 | Fidelity Title | |
| Debonis Ted S | -- | -- |
Source: Public Records
Mortgage History
| Date | Status | Borrower | Loan Amount |
|---|---|---|---|
| Previous Owner | Linder Edward | $560,000 | |
| Previous Owner | May William Michael | $450,000 |
Source: Public Records
Tax History
| Year | Tax Paid | Tax Assessment Tax Assessment Total Assessment is a certain percentage of the fair market value that is determined by local assessors to be the total taxable value of land and additions on the property. | Land | Improvement |
|---|---|---|---|---|
| 2025 | $17,055 | $1,577,000 | $552,000 | $1,025,000 |
| 2024 | $16,839 | $1,577,000 | $552,000 | $1,025,000 |
| 2023 | $15,439 | $1,438,000 | $503,000 | $935,000 |
| 2022 | $14,078 | $1,313,000 | $460,000 | $853,000 |
| 2021 | $12,722 | $1,163,000 | $407,000 | $756,000 |
| 2020 | $11,970 | $1,113,000 | $392,200 | $720,800 |
| 2019 | $11,481 | $1,050,000 | $370,000 | $680,000 |
| 2018 | $13,425 | $1,236,300 | $432,900 | $803,400 |
| 2017 | $12,667 | $1,177,400 | $412,300 | $765,100 |
| 2016 | $12,002 | $1,121,400 | $392,700 | $728,700 |
| 2015 | $11,337 | $1,068,000 | $374,000 | $694,000 |
| 2014 | $10,089 | $957,000 | $335,000 | $622,000 |
Source: Public Records
Map
Nearby Homes
- 256 W 18th St
- 1695 N Palm Ave
- 252 W 19th St
- 1629 N Palm Ave
- 1742 N Albright Ave
- 779 Coral Tree Way
- 1844 N 1st Ave
- 1669 N San Antonio Ave
- 1623 N Vallejo Way
- 635 W 16th St
- 888 Via Maria
- 1931 Eloise Way
- 1503 N Albright Ave
- 907 Pineridge St
- 141 W 21st St
- 1613 Erin Ave
- 1234 Fairway Cir
- 1238 Fairway Cir
- 171 E 14th St
- 1631 Carmel Cir E
- 304 W Clark St
- 390 W Clark St
- 1752 N Redding Way
- 1753 N Palm Ave
- 337 W Clark St
- 270 W Clark St
- 381 W Clark St
- 1746 N Redding Way
- 299 W Clark St
- 428 W Clark St
- 1741 N Palm Ave
- 419 W Clark St
- 1753 N Redding Way
- 1738 N Redding Way
- 336 W 18th St
- 450 W Clark St
- 257 W Clark St
- 380 W 18th St
- 298 W 18th St
- 453 W Clark St
Your Personal Tour Guide
Ask me questions while you tour the home.