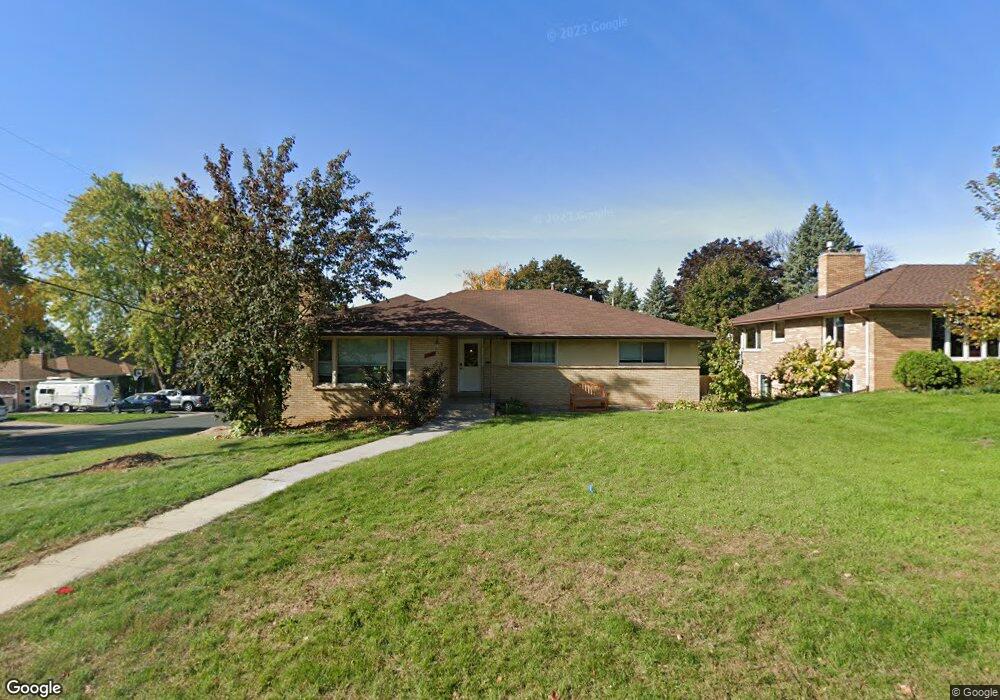
3400 3400 Belden Dr NE St. Anthony, MN 55418
Estimated Value: $577,000 - $692,000
5
Beds
3
Baths
1,744
Sq Ft
$370/Sq Ft
Est. Value
About This Home
This home is located at 3400 3400 Belden Dr NE, St. Anthony, MN 55418 and is currently estimated at $644,612, approximately $369 per square foot. 3400 3400 Belden Dr NE is a home located in Hennepin County with nearby schools including Wilshire Park Elementary School, Highland Elementary School, and St. Anthony Middle School.
Ownership History
Date
Name
Owned For
Owner Type
Purchase Details
Closed on
May 26, 2023
Sold by
Nelson Trenton and Nelson Melissa
Bought by
Kiefer Deidre and Kamrath Christopher
Current Estimated Value
Home Financials for this Owner
Home Financials are based on the most recent Mortgage that was taken out on this home.
Original Mortgage
$305,437
Outstanding Balance
$296,757
Interest Rate
6.27%
Mortgage Type
New Conventional
Estimated Equity
$347,855
Purchase Details
Closed on
May 24, 2023
Sold by
Nelson Trenton R and Nelson Melissa M
Bought by
Kiefer Deidre Marie and Kamrath Christopher Alan
Home Financials for this Owner
Home Financials are based on the most recent Mortgage that was taken out on this home.
Original Mortgage
$305,437
Outstanding Balance
$296,757
Interest Rate
6.27%
Mortgage Type
New Conventional
Estimated Equity
$347,855
Purchase Details
Closed on
Jun 24, 2008
Sold by
Squires Lynn Marie
Bought by
Gunderson Anita and Gunderson Todd
Purchase Details
Closed on
Apr 29, 2005
Sold by
Woitas John O and Woitas Renee H
Bought by
Squires Lynn M
Purchase Details
Closed on
May 26, 2004
Sold by
Lofgren Richard E
Bought by
Woitas John O and Woitas Renee E
Create a Home Valuation Report for This Property
The Home Valuation Report is an in-depth analysis detailing your home's value as well as a comparison with similar homes in the area
Home Values in the Area
Average Home Value in this Area
Purchase History
| Date | Buyer | Sale Price | Title Company |
|---|---|---|---|
| Kiefer Deidre | $675,000 | -- | |
| Kiefer Deidre Marie | $675,000 | Titlesmart | |
| Gunderson Anita | $405,000 | -- | |
| Squires Lynn M | $424,900 | -- | |
| Woitas John O | $274,900 | -- |
Source: Public Records
Mortgage History
| Date | Status | Borrower | Loan Amount |
|---|---|---|---|
| Open | Kiefer Deidre | $305,437 | |
| Closed | Kiefer Deidre Marie | $305,437 |
Source: Public Records
Tax History Compared to Growth
Tax History
| Year | Tax Paid | Tax Assessment Tax Assessment Total Assessment is a certain percentage of the fair market value that is determined by local assessors to be the total taxable value of land and additions on the property. | Land | Improvement |
|---|---|---|---|---|
| 2024 | $11,449 | $640,600 | $210,000 | $430,600 |
| 2023 | $10,811 | $632,500 | $190,000 | $442,500 |
| 2022 | $9,268 | $599,000 | $182,000 | $417,000 |
| 2021 | $8,674 | $546,000 | $186,000 | $360,000 |
| 2020 | $8,890 | $516,000 | $168,000 | $348,000 |
| 2019 | $8,507 | $504,000 | $165,000 | $339,000 |
| 2018 | $8,175 | $465,000 | $125,000 | $340,000 |
| 2017 | $8,151 | $436,000 | $109,000 | $327,000 |
| 2016 | $8,081 | $432,000 | $100,000 | $332,000 |
| 2015 | $7,253 | $374,000 | $97,000 | $277,000 |
| 2014 | -- | $351,000 | $77,000 | $274,000 |
Source: Public Records
Map
Nearby Homes
- 3212 33rd Ave NE
- 2517 36th Ave NE
- 3637 Coolidge St NE
- 2900 31st Ave NE
- 2916 31st Ave NE
- 3243 Mckinley St NE
- 3013 Silver Lake Rd NE
- 3642 Stinson Blvd
- 3511 Maplewood Dr
- 2550 38th Ave NE Unit 112
- 2540 38th Ave NE Unit 217
- 2904 Old Highway 8
- 2405 39th Ave NE Unit 307
- 3153 Old Highway 8 Unit B103A
- 3153 Old Highway 8 Unit 304A
- 2496 County Road C2 W Unit 303
- 3212 29th Ave NE
- 3808 Foss Rd Unit 2
- 2911 Troseth Rd
- 3027 Garfield St NE
- 3400 3400 Belden-Drive-ne
- 3401 Belden Dr NE
- 3400 Belden Dr NE
- 3404 Belden Dr NE
- 3405 Belden Dr NE
- 3404 Belden Dr NE
- 3335 Belden Dr NE
- 2820 34th Ave NE
- 3409 Belden Dr NE
- 3408 Belden Dr NE
- 3400 Silver Lake Rd NE
- 3331 Belden Dr NE
- 3411 Belden Dr NE
- 3401 Coolidge St NE
- 3404 Silver Lake Rd NE
- 3411 Belden Dr NE
- 2816 34th Ave NE
- 3412 Belden Dr NE
- 3400 Silver Lake Rd NE
- 3405 Coolidge St NE