Estimated Value: $156,000 - $488,000
3
Beds
2
Baths
1,645
Sq Ft
$235/Sq Ft
Est. Value
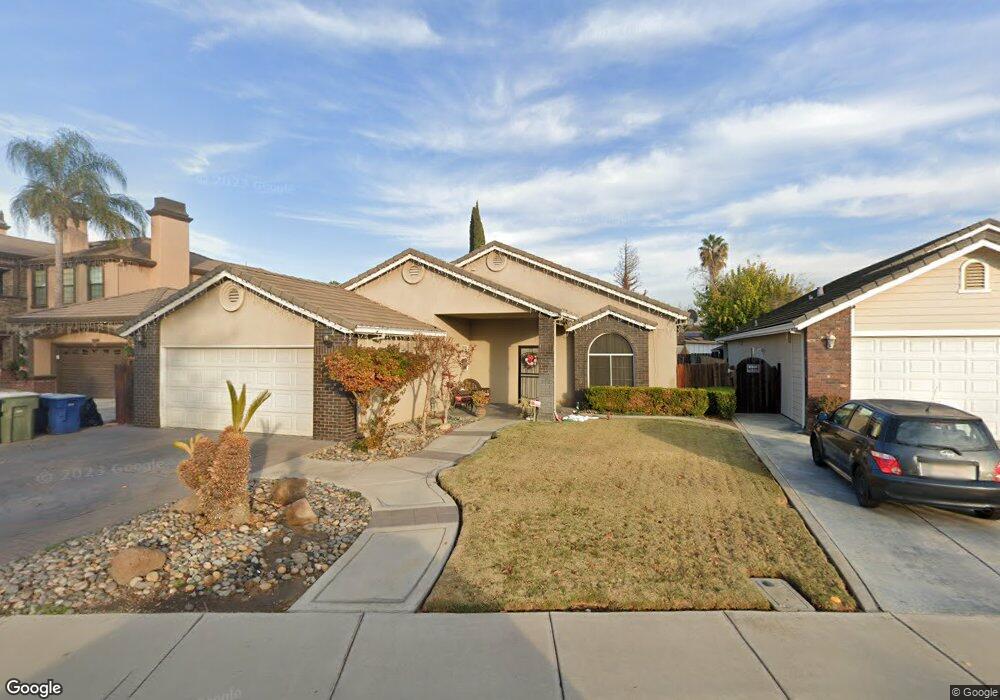
About This Home
This home is located at 3400 Castiglione Way, Ceres, CA 95307 and is currently estimated at $385,810, approximately $234 per square foot. 3400 Castiglione Way is a home located in Stanislaus County with nearby schools including Joel J. Hidahl Elementary School, Blaker-Kinser Junior High School, and Central Valley High School.
Ownership History
Date
Name
Owned For
Owner Type
Purchase Details
Closed on
Jun 14, 2010
Sold by
Teaney Garland C
Bought by
Narayan Nilesh
Current Estimated Value
Home Financials for this Owner
Home Financials are based on the most recent Mortgage that was taken out on this home.
Original Mortgage
$146,033
Outstanding Balance
$100,381
Interest Rate
5.5%
Mortgage Type
FHA
Estimated Equity
$285,429
Purchase Details
Closed on
Jul 19, 2005
Sold by
Teaney Sarita K
Bought by
Teaney Garland C
Home Financials for this Owner
Home Financials are based on the most recent Mortgage that was taken out on this home.
Original Mortgage
$267,300
Interest Rate
5.51%
Mortgage Type
New Conventional
Purchase Details
Closed on
Mar 6, 2000
Sold by
Castiglione John J and Castiglione Rose
Bought by
Teaney Garland C and Teaney Sarita K
Create a Home Valuation Report for This Property
The Home Valuation Report is an in-depth analysis detailing your home's value as well as a comparison with similar homes in the area
Home Values in the Area
Average Home Value in this Area
Purchase History
| Date | Buyer | Sale Price | Title Company |
|---|---|---|---|
| Narayan Nilesh | $148,000 | Chicago Title Company | |
| Teaney Garland C | -- | Alliance Title Company | |
| Teaney Garland C | $30,000 | Stewart Title |
Source: Public Records
Mortgage History
| Date | Status | Borrower | Loan Amount |
|---|---|---|---|
| Open | Narayan Nilesh | $146,033 | |
| Previous Owner | Teaney Garland C | $267,300 |
Source: Public Records
Tax History Compared to Growth
Tax History
| Year | Tax Paid | Tax Assessment Tax Assessment Total Assessment is a certain percentage of the fair market value that is determined by local assessors to be the total taxable value of land and additions on the property. | Land | Improvement |
|---|---|---|---|---|
| 2024 | $2,136 | $187,280 | $63,268 | $124,012 |
| 2023 | $2,078 | $183,609 | $62,028 | $121,581 |
| 2022 | $2,059 | $180,010 | $60,812 | $119,198 |
| 2021 | $2,038 | $176,481 | $59,620 | $116,861 |
| 2020 | $1,976 | $174,672 | $59,009 | $115,663 |
| 2019 | $1,963 | $171,248 | $57,852 | $113,396 |
| 2018 | $1,922 | $167,891 | $56,718 | $111,173 |
| 2017 | $1,907 | $164,600 | $55,606 | $108,994 |
| 2016 | $1,868 | $161,373 | $54,516 | $106,857 |
| 2015 | $1,843 | $158,950 | $53,698 | $105,252 |
| 2014 | $1,806 | $155,838 | $52,647 | $103,191 |
Source: Public Records
Map
Nearby Homes
- 3501 Soda Canyon Dr
- 3116 Larrynell Dr
- 3005 Willetts Way
- 1628 Sungate Dr
- 1717 Don Pedro Rd
- 1724 Don Pedro Rd
- 1617 Heath Way
- 1429 Don Pedro Rd
- 1432 Don Pedro Rd
- 2005 Pleasant Ave
- 2111 Hackett Rd
- 3033 Railroad Ave
- 3939 Central Ave Unit 84
- 3939 Central Ave Unit 35
- 3129 Malik Ave
- 2873 Malik Ave
- 3600 Spruce Ave
- 926 Alcoy Dr
- 3096 Castle Rock Ct
- 1255 Montclaire Dr
- 3404 Castiglione Way
- 3304 Castiglione Way
- 4238 Castiglione Way
- 3408 Castiglione Way
- 3313 Blaker Rd
- 3407 Castiglione Way
- 1622 Hackett Rd
- 3401 Blaker Rd
- 3412 Castiglione Way
- 1609 Inland Ln
- 1609 Graham Ln
- 3309 Blaker Rd
- 1624 Hackett Rd
- 1620 Hackett Rd
- 3405 Blaker Rd
- 1604 Graham Ln
- 3305 Blaker Rd
- 1605 Inland Ln
- 1626 Hackett Rd
- 1605 Graham Ln