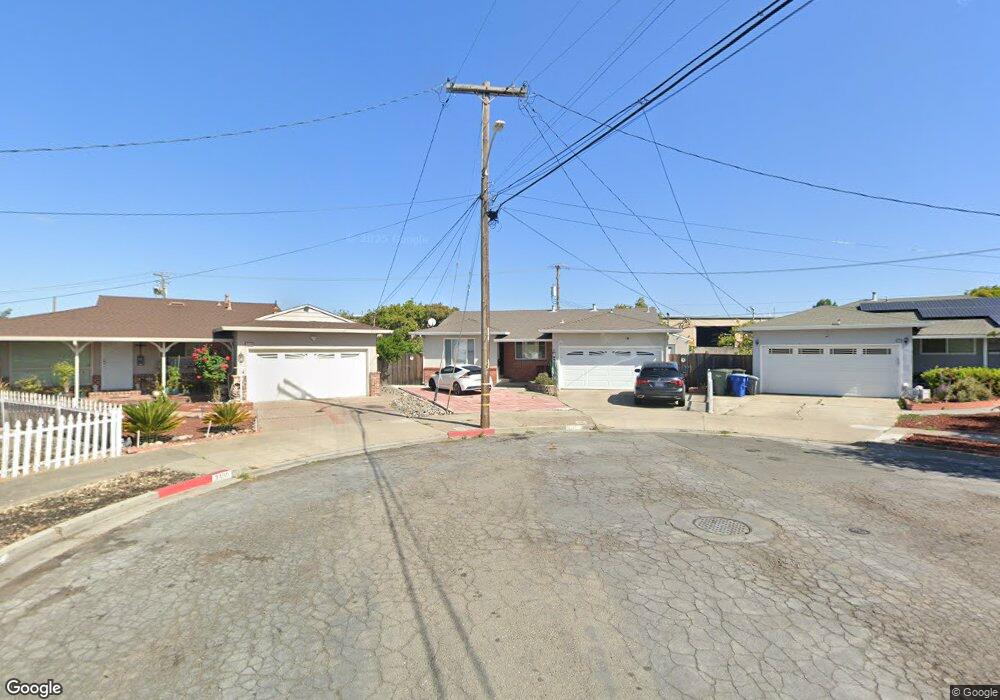
3400 Del Monte Way San Leandro, CA 94578
Floresta Gardens-Bradrick NeighborhoodEstimated Value: $813,000 - $826,128
3
Beds
2
Baths
1,142
Sq Ft
$717/Sq Ft
Est. Value
About This Home
This home is located at 3400 Del Monte Way, San Leandro, CA 94578 and is currently estimated at $819,282, approximately $717 per square foot. 3400 Del Monte Way is a home located in Alameda County with nearby schools including Monroe Elementary School, John Muir Middle School, and San Leandro High School.
Ownership History
Date
Name
Owned For
Owner Type
Purchase Details
Closed on
Feb 12, 2019
Sold by
Parker Lecia Ann and Parker Thomas David
Bought by
Chen Yan Yu and Huang Yan Lan
Current Estimated Value
Home Financials for this Owner
Home Financials are based on the most recent Mortgage that was taken out on this home.
Original Mortgage
$455,000
Outstanding Balance
$406,766
Interest Rate
5.37%
Mortgage Type
Adjustable Rate Mortgage/ARM
Estimated Equity
$412,516
Purchase Details
Closed on
Nov 3, 2018
Sold by
Parker Tanner Jay and Parker Troy Henry
Bought by
Parker Lecia Ann and Parker Thomas David
Purchase Details
Closed on
Nov 17, 2006
Sold by
Foster Bruce A and Parker Lecia A
Bought by
Foster Brian John and Foster Bruce Alan
Home Financials for this Owner
Home Financials are based on the most recent Mortgage that was taken out on this home.
Original Mortgage
$25,000
Interest Rate
6.37%
Mortgage Type
Credit Line Revolving
Purchase Details
Closed on
Sep 25, 1998
Sold by
Foster Lorraine
Bought by
Foster Lorraine and Foster Bruce A
Create a Home Valuation Report for This Property
The Home Valuation Report is an in-depth analysis detailing your home's value as well as a comparison with similar homes in the area
Home Values in the Area
Average Home Value in this Area
Purchase History
| Date | Buyer | Sale Price | Title Company |
|---|---|---|---|
| Chen Yan Yu | $650,000 | Old Republic Title Company | |
| Parker Lecia Ann | -- | None Available | |
| Foster Brian John | $25,000 | North American Title Co | |
| Foster Lorraine | -- | -- |
Source: Public Records
Mortgage History
| Date | Status | Borrower | Loan Amount |
|---|---|---|---|
| Open | Chen Yan Yu | $455,000 | |
| Previous Owner | Foster Brian John | $25,000 |
Source: Public Records
Tax History
| Year | Tax Paid | Tax Assessment Tax Assessment Total Assessment is a certain percentage of the fair market value that is determined by local assessors to be the total taxable value of land and additions on the property. | Land | Improvement |
|---|---|---|---|---|
| 2025 | $9,634 | $725,074 | $217,522 | $507,552 |
| 2024 | $9,634 | $710,858 | $213,257 | $497,601 |
| 2023 | $9,571 | $696,923 | $209,077 | $487,846 |
| 2022 | $9,306 | $683,260 | $204,978 | $478,282 |
| 2021 | $9,021 | $669,863 | $200,959 | $468,904 |
| 2020 | $8,788 | $663,000 | $198,900 | $464,100 |
| 2019 | $2,937 | $185,232 | $63,525 | $121,707 |
| 2018 | $2,846 | $182,019 | $62,405 | $119,614 |
| 2017 | $2,819 | $178,450 | $61,181 | $117,269 |
| 2016 | $2,682 | $174,952 | $59,982 | $114,970 |
| 2015 | $2,635 | $172,325 | $59,081 | $113,244 |
| 2014 | $2,610 | $168,950 | $57,924 | $111,026 |
Source: Public Records
Map
Nearby Homes
- 3601 Figueroa Dr
- 14240 Rose Dr
- 2399 E 14th St Unit 66
- 2399 E 14th St Unit 24
- 2399 E 14th St Unit 112
- 2399 E 14th St Unit 44
- 391 Anza Way
- 1316 135th Ave
- 14831 Bancroft Ave Unit Space 27
- 475 Nabor St
- 1250 Hubbard Ave
- 15065 Hesperian Blvd Unit 22
- 2144 Alvarado St
- 15016 Fleming St
- 15040 Fleming St
- 15018 Edgemoor St
- 2062 Washington Ave
- 15289 Upton Ave
- 15263 Hesperian Blvd Unit 13
- 15106 Edgemoor St
- 3406 Del Monte Way
- 3405 Del Monte Way
- 3412 Del Monte Way
- 3429 Del Monte Way
- 3428 Del Monte Way
- 3408 Del Rio Cir
- 3416 Del Rio Cir
- 3454 Del Monte Way
- 3420 Del Rio Cir
- 701 Portola Dr
- 3405 Monogram St
- 3404 Del Rio Cir
- 3407 Monogram St
- 707 Portola Dr
- 3478 Del Monte Way
- 3409 Monogram St
- 3411 Monogram St
- 715 Portola Dr
- 3403 Monogram St
- 3413 Monogram St
Your Personal Tour Guide
Ask me questions while you tour the home.