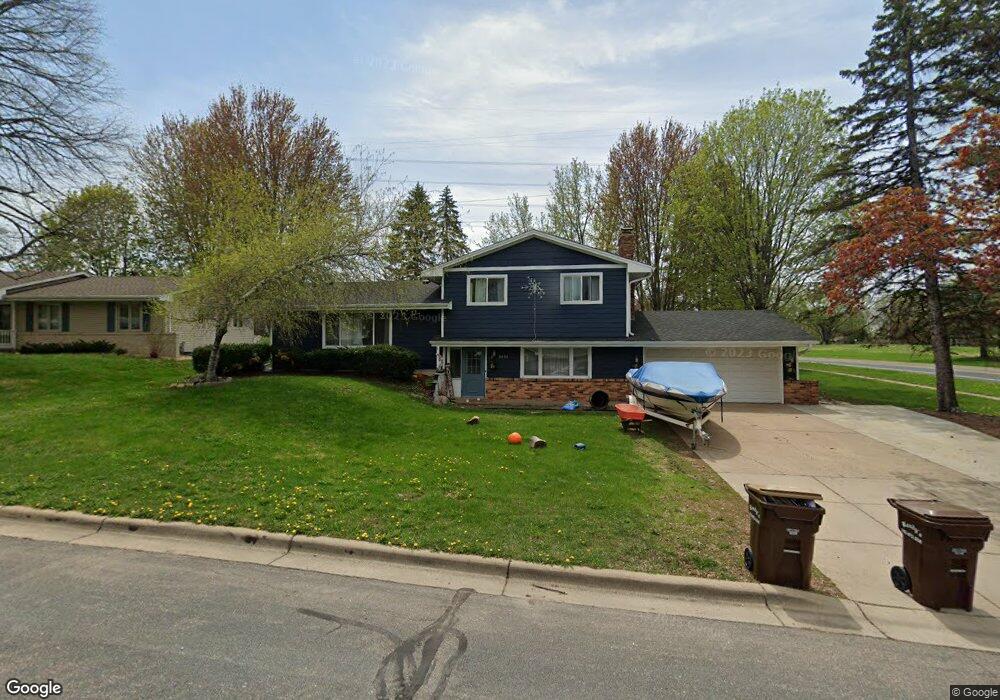
3401 Clark St Burnsville, MN 55337
Estimated Value: $395,000 - $400,000
4
Beds
2
Baths
1,896
Sq Ft
$210/Sq Ft
Est. Value
About This Home
This home is located at 3401 Clark St, Burnsville, MN 55337 and is currently estimated at $397,213, approximately $209 per square foot. 3401 Clark St is a home located in Dakota County with nearby schools including William Byrne Elementary School, Burnsville High School, and Gateway STEM Academy.
Ownership History
Date
Name
Owned For
Owner Type
Purchase Details
Closed on
Sep 13, 2017
Sold by
The Secretary Of Housing And Urban Devel
Bought by
Quito Manuel Lala
Current Estimated Value
Purchase Details
Closed on
May 19, 2017
Sold by
U S Bank N A
Bought by
The Secretary Of Housing & Urvab Devlopm
Purchase Details
Closed on
Dec 29, 2015
Sold by
Clayton Malik Z and Clayton Sara L
Bought by
Us Bank National Association
Purchase Details
Closed on
Sep 27, 2013
Sold by
Clayton Sara L
Bought by
Clayton Malik Z
Purchase Details
Closed on
Jun 14, 2010
Sold by
Linero Fernando M and Harkness Jane
Bought by
Clayton Malik Z and Clayton Sara L
Purchase Details
Closed on
Jun 3, 2004
Sold by
Golden Michael P and Golden Stephanie J
Bought by
Linero Fernando M
Purchase Details
Closed on
Jun 28, 2000
Sold by
Dressel Donald D and Dressel Patricia M
Bought by
Golden Michael P and Golden Stephanie J
Create a Home Valuation Report for This Property
The Home Valuation Report is an in-depth analysis detailing your home's value as well as a comparison with similar homes in the area
Home Values in the Area
Average Home Value in this Area
Purchase History
| Date | Buyer | Sale Price | Title Company |
|---|---|---|---|
| Quito Manuel Lala | -- | Watermark Title Agency | |
| The Secretary Of Housing & Urvab Devlopm | -- | None Available | |
| Us Bank National Association | $188,378 | Attorney | |
| Clayton Malik Z | -- | None Available | |
| Clayton Malik Z | $210,000 | -- | |
| Linero Fernando M | $240,000 | -- | |
| Golden Michael P | $179,900 | -- |
Source: Public Records
Tax History Compared to Growth
Tax History
| Year | Tax Paid | Tax Assessment Tax Assessment Total Assessment is a certain percentage of the fair market value that is determined by local assessors to be the total taxable value of land and additions on the property. | Land | Improvement |
|---|---|---|---|---|
| 2024 | $3,762 | $351,500 | $83,100 | $268,400 |
| 2023 | $3,734 | $361,100 | $83,200 | $277,900 |
| 2022 | $3,118 | $353,500 | $83,000 | $270,500 |
| 2021 | $3,150 | $298,000 | $72,200 | $225,800 |
| 2020 | $3,090 | $286,400 | $68,600 | $217,800 |
| 2019 | $2,986 | $271,900 | $65,400 | $206,500 |
| 2018 | $2,908 | $251,900 | $62,200 | $189,700 |
| 2017 | $2,842 | $239,200 | $59,300 | $179,900 |
| 2016 | $3,311 | $217,300 | $56,500 | $160,800 |
| 2015 | $3,197 | $213,300 | $54,800 | $158,500 |
| 2014 | -- | $208,700 | $53,800 | $154,900 |
| 2013 | -- | $189,700 | $49,300 | $140,400 |
Source: Public Records
Map
Nearby Homes
- 11459 Galtier Dr
- 4413 Slater Rd
- 4427 Cinnamon Ridge Cir
- 4425 Cinnamon Ridge Cir
- 10934 Southview Dr
- 4463 Cinnamon Ridge Cir
- 3017 Mcleod St
- 11036 27th Ave S
- 11017 27th Ave S
- 4165 Old Sibley Hwy
- 3108 Foxpoint Cir
- 11115 Carver Ct
- 4370 Nicols Rd
- 3113 Chandler Ct
- 2177 Cool Stream Cir
- 11902 River Hills Cir
- 3309 Red Oak Cir N
- 4632 Westwood Ln
- 2081 Copper Ln
- 2123 Cliffhill Ln
- 3405 Clark St
- 3409 Clark St
- 3400 Clark St
- 11320 River Hills Dr
- 11316 River Hills Dr
- 3404 Clark St
- 11312 River Hills Dr
- 3408 Clark St
- 3413 Clark St
- 11455 Galtier Dr
- 11457 Galtier Dr
- 11305 River Hills Dr
- 11308 River Hills Dr
- 3412 Clark St
- 3417 Clark St
- 11461 Galtier Dr
- 11304 River Hills Dr
- 11220 Lewis Ct
- 11301 River Hills Dr
- 3416 Clark St