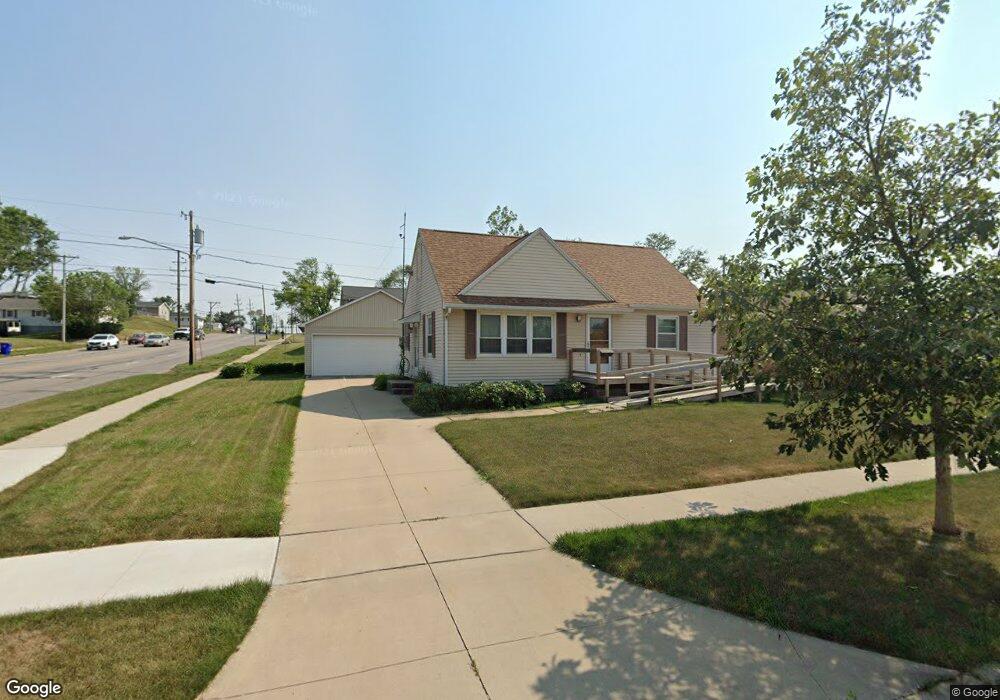
3401 Dennis Dr NW Cedar Rapids, IA 52405
Estimated Value: $160,000 - $171,000
2
Beds
1
Bath
833
Sq Ft
$199/Sq Ft
Est. Value
About This Home
This home is located at 3401 Dennis Dr NW, Cedar Rapids, IA 52405 and is currently estimated at $165,379, approximately $198 per square foot. 3401 Dennis Dr NW is a home located in Linn County with nearby schools including Junction City Elementary School, Hoover Elementary School, and Kentucky Tech - Ashland Reg Tech Center.
Ownership History
Date
Name
Owned For
Owner Type
Purchase Details
Closed on
Aug 15, 2024
Sold by
Horning Lanae M and Horning Michael J
Bought by
Horning Wyatt D
Current Estimated Value
Home Financials for this Owner
Home Financials are based on the most recent Mortgage that was taken out on this home.
Original Mortgage
$128,000
Outstanding Balance
$126,241
Interest Rate
6.25%
Mortgage Type
New Conventional
Estimated Equity
$39,138
Purchase Details
Closed on
Aug 23, 2023
Sold by
Cedar Rapids Bank & Trust
Bought by
Horning Lanea M and Horning Michael J
Home Financials for this Owner
Home Financials are based on the most recent Mortgage that was taken out on this home.
Original Mortgage
$48,000
Interest Rate
6.5%
Mortgage Type
New Conventional
Purchase Details
Closed on
Aug 15, 2003
Sold by
Kellogg Nancy Lynne Oconnor and Kellogg Eugene Calvin
Bought by
Kellogg Nancy Lynne Oconnor and Nancy Lynne Oconnor Kellogg Revocable Tr
Create a Home Valuation Report for This Property
The Home Valuation Report is an in-depth analysis detailing your home's value as well as a comparison with similar homes in the area
Home Values in the Area
Average Home Value in this Area
Purchase History
| Date | Buyer | Sale Price | Title Company |
|---|---|---|---|
| Horning Wyatt D | $160,000 | River Ridge Escrow | |
| Horning Lanea M | -- | None Listed On Document | |
| Horning Lanea M | $60,000 | None Listed On Document | |
| Horning Lanea M | -- | None Listed On Document | |
| Kellogg Nancy Lynne Oconnor | -- | -- |
Source: Public Records
Mortgage History
| Date | Status | Borrower | Loan Amount |
|---|---|---|---|
| Open | Horning Wyatt D | $128,000 | |
| Previous Owner | Horning Lanea M | $48,000 |
Source: Public Records
Tax History Compared to Growth
Tax History
| Year | Tax Paid | Tax Assessment Tax Assessment Total Assessment is a certain percentage of the fair market value that is determined by local assessors to be the total taxable value of land and additions on the property. | Land | Improvement |
|---|---|---|---|---|
| 2025 | $2,496 | $155,700 | $33,500 | $122,200 |
| 2024 | $2,554 | $150,400 | $30,600 | $119,800 |
| 2023 | $2,554 | $141,000 | $30,600 | $110,400 |
| 2022 | $2,410 | $121,100 | $26,200 | $94,900 |
| 2021 | $2,478 | $116,300 | $26,200 | $90,100 |
| 2020 | $2,478 | $112,300 | $23,300 | $89,000 |
| 2019 | $2,118 | $106,800 | $23,300 | $83,500 |
| 2018 | $2,056 | $106,800 | $23,300 | $83,500 |
| 2017 | $2,259 | $106,300 | $23,300 | $83,000 |
| 2016 | $2,259 | $106,300 | $23,300 | $83,000 |
| 2015 | $2,337 | $109,881 | $23,280 | $86,601 |
| 2014 | $2,152 | $109,881 | $23,280 | $86,601 |
| 2013 | $2,102 | $109,881 | $23,280 | $86,601 |
Source: Public Records
Map
Nearby Homes
- 3416 Sue Ln NW
- 201 Edgewood Rd NW
- 211 Edgewood Rd NW
- 3013 Sue Ln NW
- 225 31st St NW
- 3107 Johnson Ave NW Unit 4
- 3403 1st Ave SW
- 56 Julia Ann Dr NW
- 3600 Midway Dr NW
- 327 NW Edgewood Rd Unit 324, 330, 336, 342 C
- 232 27th St NW
- 3724 2nd Ave SW
- 3109 12th Ave SW
- 3509 E Ave NW Unit D
- 1410 Adair Ct SW Unit Lot 2
- 3507 E Ave NW Unit F
- 159 26th St NW
- 425 28th St NW
- 312 24th Ave NW
- 2433 8th Ave SW
- 3405 Dennis Dr NW
- 3404 Sue Ln NW
- 3411 Dennis Dr NW
- 3400 Dennis Dr NW
- 3410 Sue Ln NW
- 3324 Sue Ln NW
- 101 Edgewood Rd NW
- 105 Edgewood Rd NW
- 3415 Dennis Dr NW
- 109 Wesley Dr NW
- 116 Edgewood Rd NW
- 109 Edgewood Rd NW
- 3316 Sue Ln NW
- 115 Wesley Dr NW
- 3419 Dennis Dr NW
- 74 Edgewood Rd NW
- 122 Edgewood Rd NW
- 3422 Sue Ln NW
- 3317 Susan Dr NW
- 121 Wesley Dr NW