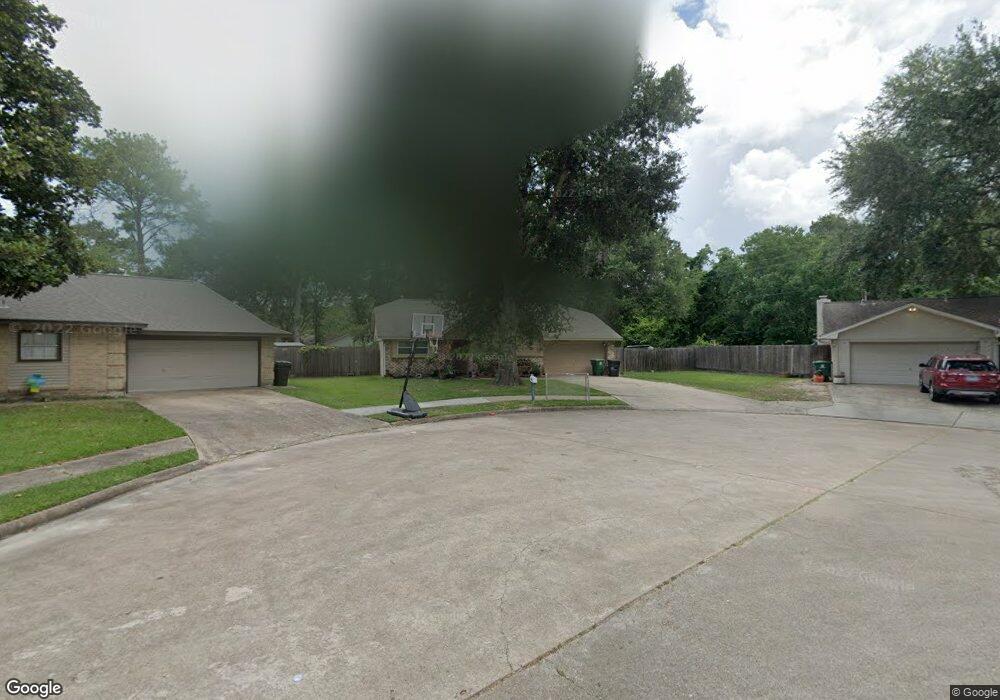
3402 Lemon Tree Ln Houston, TX 77088
Greater Inwood NeighborhoodEstimated Value: $219,000 - $259,000
3
Beds
2
Baths
1,523
Sq Ft
$158/Sq Ft
Est. Value
About This Home
This home is located at 3402 Lemon Tree Ln, Houston, TX 77088 and is currently estimated at $240,189, approximately $157 per square foot. 3402 Lemon Tree Ln is a home located in Harris County with nearby schools including Stovall School, Caraway Intermediate School, and Caraway Elementary School.
Ownership History
Date
Name
Owned For
Owner Type
Purchase Details
Closed on
Dec 16, 2008
Sold by
Tonelli Bryan L
Bought by
Keehnen Jenna A
Current Estimated Value
Purchase Details
Closed on
Jan 5, 2007
Sold by
Wells Fargo Bank Na
Bought by
Keehnen Jenna A and Tonelli Bryan L
Home Financials for this Owner
Home Financials are based on the most recent Mortgage that was taken out on this home.
Original Mortgage
$83,000
Outstanding Balance
$49,324
Interest Rate
6.11%
Mortgage Type
Purchase Money Mortgage
Estimated Equity
$190,865
Purchase Details
Closed on
Oct 3, 2006
Sold by
Eguia Andres S
Bought by
Wells Fargo Bank Na and Mastr Asset Backed Securities Trust 2003
Purchase Details
Closed on
Oct 21, 2002
Sold by
Haralson Dennis Lynn and Haralson Rebecca Anne
Bought by
Eguia Andres S
Home Financials for this Owner
Home Financials are based on the most recent Mortgage that was taken out on this home.
Original Mortgage
$63,000
Interest Rate
7.6%
Create a Home Valuation Report for This Property
The Home Valuation Report is an in-depth analysis detailing your home's value as well as a comparison with similar homes in the area
Home Values in the Area
Average Home Value in this Area
Purchase History
| Date | Buyer | Sale Price | Title Company |
|---|---|---|---|
| Keehnen Jenna A | -- | None Available | |
| Keehnen Jenna A | -- | Fidelity National Title #29 | |
| Wells Fargo Bank Na | $87,146 | None Available | |
| Eguia Andres S | -- | South Land Title Company |
Source: Public Records
Mortgage History
| Date | Status | Borrower | Loan Amount |
|---|---|---|---|
| Open | Keehnen Jenna A | $83,000 | |
| Previous Owner | Eguia Andres S | $63,000 | |
| Closed | Keehnen Jenna A | $0 |
Source: Public Records
Tax History Compared to Growth
Tax History
| Year | Tax Paid | Tax Assessment Tax Assessment Total Assessment is a certain percentage of the fair market value that is determined by local assessors to be the total taxable value of land and additions on the property. | Land | Improvement |
|---|---|---|---|---|
| 2025 | $2,566 | $250,848 | $102,588 | $148,260 |
| 2024 | $2,566 | $253,645 | $102,588 | $151,057 |
| 2023 | $2,566 | $272,397 | $102,588 | $169,809 |
| 2022 | $3,506 | $233,143 | $86,088 | $147,055 |
| 2021 | $3,338 | $192,881 | $71,740 | $121,141 |
| 2020 | $3,189 | $179,044 | $71,740 | $107,304 |
| 2019 | $3,039 | $125,390 | $34,693 | $90,697 |
| 2018 | $1,075 | $107,667 | $20,110 | $87,557 |
| 2017 | $2,408 | $107,667 | $20,110 | $87,557 |
| 2016 | $2,189 | $107,667 | $20,110 | $87,557 |
| 2015 | $1,444 | $93,663 | $20,110 | $73,553 |
| 2014 | $1,444 | $79,504 | $20,110 | $59,394 |
Source: Public Records
Map
Nearby Homes
- 3414 Lemon Tree Ln
- 3306 Elmcrest Dr
- 7903 Sunnyhill St
- 3522 Almington Ln
- 7610 Alperton Dr
- 3503 Cherry Forest Dr
- 7726 Ashmole Ln
- 8015 Venus St Unit A/B
- 8101 Venus St Unit A/B
- 3711 Black Locust Dr
- 7816 Inwood Grove Ln
- DOVE Plan at Alaia Crossing
- CEDAR Plan at Alaia Crossing
- BOXWOOD Plan at Alaia Crossing
- 7926 Easter St
- 8010 Easter St
- 7702 Inwood Hills Ln
- 8210 Venus St
- 8337 Sunnyhill St
- 8303 Venus St
- 7426 Ashmole Ln
- 3403 Saratoga Dr
- 3406 Lemon Tree Ln
- 7502 Ashmole Ln
- 3410 Lemon Tree Ln
- 3407 Saratoga Dr
- 7422 Ashmole Ln
- 3411 Saratoga Dr
- 3411 Lemon Tree Ln
- 7506 Ashmole Ln
- 7418 Ashmole Ln
- 3415 Lemon Tree Ln
- 3418 Lemon Tree Ln
- 7510 Ashmole Ln
- 7414 Ashmole Ln
- 3406 Saratoga Dr
- 0 Lincoln St
- 3402 Black Locust Dr
- 3419 Lemon Tree Ln
- 3419 Saratoga Dr