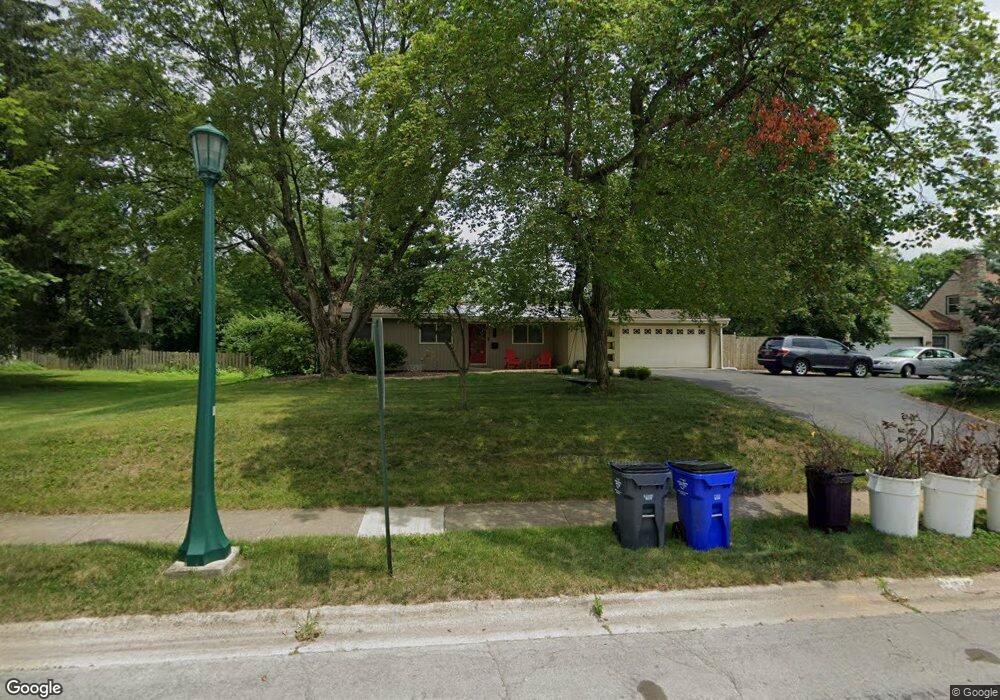
3402 Redding Rd Columbus, OH 43221
Estimated Value: $537,000 - $600,736
4
Beds
2
Baths
1,800
Sq Ft
$316/Sq Ft
Est. Value
About This Home
This home is located at 3402 Redding Rd, Columbus, OH 43221 and is currently estimated at $569,684, approximately $316 per square foot. 3402 Redding Rd is a home located in Franklin County with nearby schools including Windermere Elementary School, Hastings Middle School, and Upper Arlington High School.
Ownership History
Date
Name
Owned For
Owner Type
Purchase Details
Closed on
Jul 22, 2009
Sold by
Kim Jhin Kyung and Kim Jeanne Marie
Bought by
Feamster James R and Feamster Alison L
Current Estimated Value
Home Financials for this Owner
Home Financials are based on the most recent Mortgage that was taken out on this home.
Original Mortgage
$193,400
Outstanding Balance
$126,546
Interest Rate
5.36%
Mortgage Type
Purchase Money Mortgage
Estimated Equity
$443,138
Purchase Details
Closed on
Aug 3, 2007
Sold by
Lyons Vincent L and Lyons Pauletta M
Bought by
Kim Jhin Kyung and Kim Jeanne Marie
Purchase Details
Closed on
Apr 27, 2005
Sold by
Dupler Dale Dan and Dupler Myrna S
Bought by
Lyons Vincent L and Lyons Pauletta M
Home Financials for this Owner
Home Financials are based on the most recent Mortgage that was taken out on this home.
Original Mortgage
$182,040
Interest Rate
6.06%
Mortgage Type
FHA
Create a Home Valuation Report for This Property
The Home Valuation Report is an in-depth analysis detailing your home's value as well as a comparison with similar homes in the area
Home Values in the Area
Average Home Value in this Area
Purchase History
| Date | Buyer | Sale Price | Title Company |
|---|---|---|---|
| Feamster James R | $214,900 | Talon Group | |
| Kim Jhin Kyung | $220,900 | Talon Group | |
| Lyons Vincent L | $184,900 | -- |
Source: Public Records
Mortgage History
| Date | Status | Borrower | Loan Amount |
|---|---|---|---|
| Open | Feamster James R | $193,400 | |
| Previous Owner | Lyons Vincent L | $182,040 |
Source: Public Records
Tax History Compared to Growth
Tax History
| Year | Tax Paid | Tax Assessment Tax Assessment Total Assessment is a certain percentage of the fair market value that is determined by local assessors to be the total taxable value of land and additions on the property. | Land | Improvement |
|---|---|---|---|---|
| 2024 | $8,830 | $152,530 | $65,170 | $87,360 |
| 2023 | $8,721 | $152,530 | $65,170 | $87,360 |
| 2022 | $8,780 | $125,650 | $59,850 | $65,800 |
| 2021 | $7,772 | $125,650 | $59,850 | $65,800 |
| 2020 | $7,704 | $125,650 | $59,850 | $65,800 |
| 2019 | $7,354 | $106,050 | $59,850 | $46,200 |
| 2018 | $6,784 | $106,050 | $59,850 | $46,200 |
| 2017 | $7,297 | $106,050 | $59,850 | $46,200 |
| 2016 | $5,848 | $88,450 | $36,610 | $51,840 |
| 2015 | $5,942 | $88,450 | $36,610 | $51,840 |
| 2014 | $5,850 | $88,450 | $36,610 | $51,840 |
| 2013 | $2,793 | $80,395 | $33,285 | $47,110 |
Source: Public Records
Map
Nearby Homes
- 3509 Redding Rd
- 2225 Swansea Rd
- 2047 Langham Rd
- 1842 Ridgecliff Rd
- 2227 Zollinger Rd
- 3161 Avalon Rd
- 3106 Somerford Rd
- 3175 Tremont Rd Unit 504
- 3175 Tremont Rd Unit 313
- 1743 Ardleigh Rd Unit 1743
- 2370 Zollinger Rd
- 2401 Shrewsbury Rd
- 2438 Sherwood Villa Unit 5
- 3444 Sunningdale Way
- 2413 Edgevale Rd
- 2979 Avalon Rd
- 2458 Edgevale Rd
- 3015 Welsford Rd
- 2300 Hoxton Ct
- 3163 S Dorchester Rd
- 3388 Redding Rd
- 3424 Redding Rd
- 3397 Sciotangy Dr
- 3387 Sciotangy Dr
- 3403 Sciotangy Dr
- 3377 Sciotangy Dr
- 3413 Sciotangy Dr
- 3366 Redding Rd
- 3409 Redding Rd
- 3389 Redding Rd
- 3440 Redding Rd
- 3361 Sciotangy Dr
- 3421 Sciotangy Dr
- 3425 Redding Rd
- 2101 Oakmount Rd
- 3353 Sciotangy Dr
- 3435 Sciotangy Dr
- 3354 Redding Rd
- 3446 Redding Rd
- 3394 Sciotangy Dr