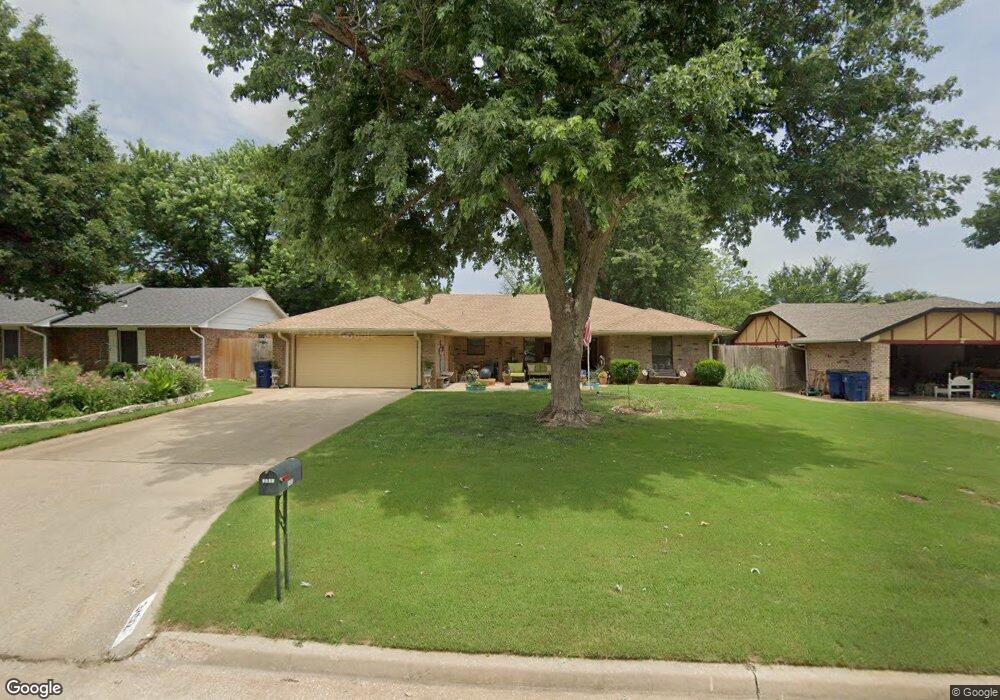
3402 Spencer Rd Duncan, OK 73533
Estimated Value: $197,055 - $235,000
3
Beds
2
Baths
1,938
Sq Ft
$114/Sq Ft
Est. Value
About This Home
This home is located at 3402 Spencer Rd, Duncan, OK 73533 and is currently estimated at $221,514, approximately $114 per square foot. 3402 Spencer Rd is a home with nearby schools including Plato Elementary School, Duncan Middle School, and Duncan High School.
Ownership History
Date
Name
Owned For
Owner Type
Purchase Details
Closed on
May 3, 2013
Sold by
Bishop Jarrod C and Bishop Larrissa D
Bought by
Havron William J and Havron Helen K
Current Estimated Value
Home Financials for this Owner
Home Financials are based on the most recent Mortgage that was taken out on this home.
Original Mortgage
$103,245
Interest Rate
3.58%
Mortgage Type
Purchase Money Mortgage
Purchase Details
Closed on
Mar 15, 2007
Sold by
Ridley Brook William and Ridley Marla D
Bought by
Bishop Jarrod C and Bishop Larrissa D
Home Financials for this Owner
Home Financials are based on the most recent Mortgage that was taken out on this home.
Original Mortgage
$123,500
Interest Rate
6.3%
Mortgage Type
New Conventional
Purchase Details
Closed on
Nov 13, 1997
Sold by
Ridley Brook W and Ridley Wife
Purchase Details
Closed on
Jun 23, 1994
Sold by
Eoff Larry and Eoff Jessica
Purchase Details
Closed on
Jun 15, 1990
Create a Home Valuation Report for This Property
The Home Valuation Report is an in-depth analysis detailing your home's value as well as a comparison with similar homes in the area
Home Values in the Area
Average Home Value in this Area
Purchase History
| Date | Buyer | Sale Price | Title Company |
|---|---|---|---|
| Havron William J | $133,500 | None Available | |
| Bishop Jarrod C | $123,500 | None Available | |
| -- | -- | -- | |
| -- | $72,000 | -- | |
| -- | $3,500 | -- |
Source: Public Records
Mortgage History
| Date | Status | Borrower | Loan Amount |
|---|---|---|---|
| Closed | Havron William J | $103,245 | |
| Previous Owner | Bishop Jarrod C | $123,500 |
Source: Public Records
Tax History Compared to Growth
Tax History
| Year | Tax Paid | Tax Assessment Tax Assessment Total Assessment is a certain percentage of the fair market value that is determined by local assessors to be the total taxable value of land and additions on the property. | Land | Improvement |
|---|---|---|---|---|
| 2025 | -- | $13,364 | $716 | $12,648 |
| 2024 | -- | $13,364 | $703 | $12,661 |
| 2023 | $0 | $13,364 | $719 | $12,645 |
| 2022 | $1,051 | $13,364 | $707 | $12,657 |
| 2021 | $1,052 | $13,363 | $923 | $12,440 |
| 2020 | $1,086 | $13,582 | $863 | $12,719 |
| 2019 | $1,088 | $13,582 | $923 | $12,659 |
| 2018 | $1,085 | $13,582 | $923 | $12,659 |
| 2017 | $1,014 | $12,802 | $923 | $11,879 |
| 2016 | $1,177 | $14,845 | $923 | $13,922 |
| 2015 | $1,061 | $14,845 | $923 | $13,922 |
| 2014 | $1,061 | $14,845 | $923 | $13,922 |
Source: Public Records
Map
Nearby Homes
- 3505 Spencer Rd
- 3202 Williamsburg St
- 0 Twilight Beach Rd Unit 38527
- 3203 Williamsburg St
- 1009 1009 Timbercreek Dr
- 1102 1102 Bent Tree
- 3412 Fox Hollow Rd
- 1209 Bent Tree St
- 1205 1205 Timbercreek Dr
- 1004 Ranchwood Place
- 2702 2702 Wildwood Place
- 1014 Oakview Dr
- 2901 2901 Timber Ridge
- 1015 1015 W Camelback
- 2518 Wildwood Place
- 1705 Foxboro Dr
- 3005 W Foxboro
- 0 Clear Springs Dr
- 5145 5145 Whispering Hills
- 1108 1108 W Plato Unit 40
- 3310 Spencer Rd
- 3406 Spencer Rd
- 3306 Spencer Rd
- 3401 Robert Dr
- 3405 Robert Dr
- 3401 Spencer Rd
- 3309 Robert Dr
- 910 Clampitt Dr
- 3309 Spencer Rd
- 3409 Robert Dr
- 3305 Robert Dr
- 3502 Spencer Rd
- 3501 Spencer Rd
- 3305 Spencer Rd
- 3302 Spencer Rd
- 3301 Spencer Rd
- 3301 Robert Dr
- 3402 Robert Dr
- 3406 Robert Dr
- 3405 N Country Club Rd