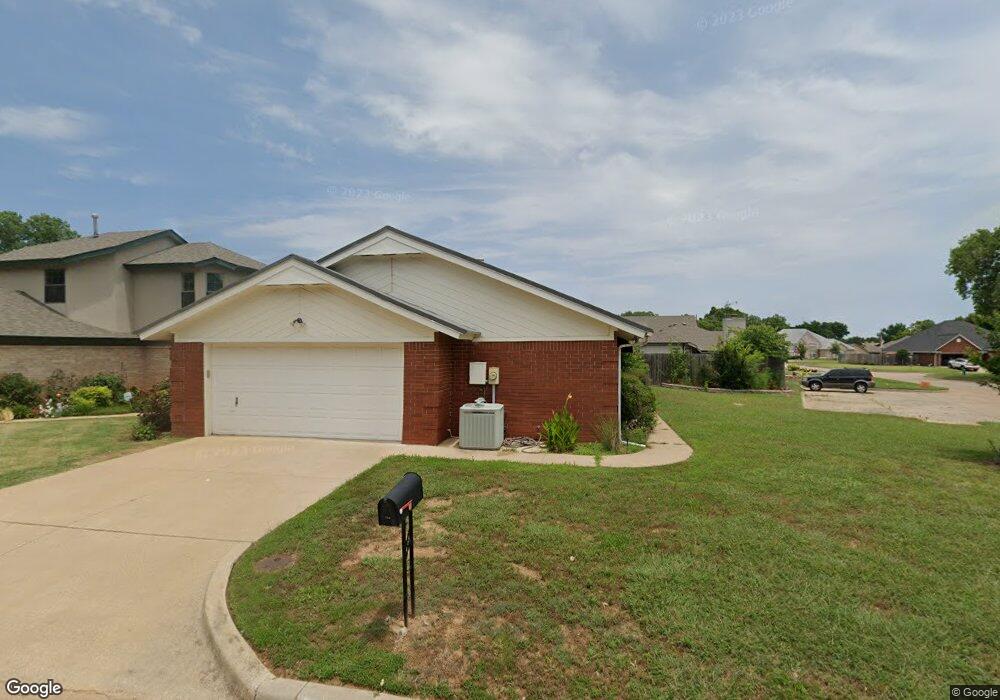
3402 Thornridge Cir Duncan, OK 73533
Estimated Value: $175,000 - $191,000
2
Beds
2
Baths
1,810
Sq Ft
$101/Sq Ft
Est. Value
About This Home
This home is located at 3402 Thornridge Cir, Duncan, OK 73533 and is currently estimated at $182,088, approximately $100 per square foot. 3402 Thornridge Cir is a home located in Stephens County with nearby schools including Plato Elementary School, Duncan Middle School, and Duncan High School.
Ownership History
Date
Name
Owned For
Owner Type
Purchase Details
Closed on
Jul 9, 2025
Sold by
Young Randy M and Young Betty A
Bought by
Randy M And Betty A Young Trust and Young
Current Estimated Value
Purchase Details
Closed on
May 7, 2021
Sold by
King Brenda Karen and King Terry
Bought by
Young Randy and Young Betty
Home Financials for this Owner
Home Financials are based on the most recent Mortgage that was taken out on this home.
Original Mortgage
$112,200
Interest Rate
3.1%
Mortgage Type
New Conventional
Purchase Details
Closed on
Apr 26, 2021
Sold by
Stewart Carolyn Cox
Bought by
King Brenda Karen and Peeler Pamela Susan
Home Financials for this Owner
Home Financials are based on the most recent Mortgage that was taken out on this home.
Original Mortgage
$112,200
Interest Rate
3.1%
Mortgage Type
New Conventional
Purchase Details
Closed on
Dec 17, 2007
Sold by
Cauthon John K and Cauthon Anita L
Bought by
Thompson Frances Lavana
Purchase Details
Closed on
Dec 10, 2002
Sold by
Stewart Carolyn and Stewart James
Bought by
Stewart James V
Create a Home Valuation Report for This Property
The Home Valuation Report is an in-depth analysis detailing your home's value as well as a comparison with similar homes in the area
Home Values in the Area
Average Home Value in this Area
Purchase History
| Date | Buyer | Sale Price | Title Company |
|---|---|---|---|
| Randy M And Betty A Young Trust | -- | None Listed On Document | |
| Randy M And Betty A Young Trust | -- | None Listed On Document | |
| Young Randy | $132,000 | Abstract Co | |
| King Brenda Karen | -- | Stephens Co Abstract Co | |
| Thompson Frances Lavana | $96,000 | None Available | |
| Stewart James V | -- | -- |
Source: Public Records
Mortgage History
| Date | Status | Borrower | Loan Amount |
|---|---|---|---|
| Previous Owner | Young Randy | $112,200 |
Source: Public Records
Tax History Compared to Growth
Tax History
| Year | Tax Paid | Tax Assessment Tax Assessment Total Assessment is a certain percentage of the fair market value that is determined by local assessors to be the total taxable value of land and additions on the property. | Land | Improvement |
|---|---|---|---|---|
| 2025 | $1,313 | $15,564 | $809 | $14,755 |
| 2024 | $1,310 | $15,385 | $809 | $14,576 |
| 2023 | $1,310 | $15,221 | $809 | $14,412 |
| 2022 | $1,240 | $14,589 | $809 | $13,780 |
| 2021 | $1,120 | $13,159 | $809 | $12,350 |
| 2020 | $1,205 | $13,953 | $809 | $13,144 |
| 2019 | $1,150 | $13,288 | $809 | $12,479 |
| 2018 | $1,220 | $13,702 | $809 | $12,893 |
| 2017 | $1,180 | $14,412 | $809 | $13,603 |
| 2016 | $1,111 | $13,073 | $809 | $12,264 |
| 2015 | $1,022 | $12,451 | $809 | $11,642 |
| 2014 | $1,022 | $11,858 | $809 | $11,049 |
Source: Public Records
Map
Nearby Homes
- 3412 Fox Hollow Rd
- 1209 Bent Tree St
- 0 Twilight Beach Rd Unit 38527
- 1205 1205 Timbercreek Dr
- 1102 1102 Bent Tree
- 3203 Williamsburg St
- 3505 Spencer Rd
- 1009 1009 Timbercreek Dr
- 3202 Williamsburg St
- 2901 2901 Timber Ridge
- 3005 W Foxboro
- 1705 Foxboro Dr
- 2702 2702 Wildwood Place
- 1004 Ranchwood Place
- 1014 Oakview Dr
- 1015 1015 W Camelback
- 2518 Wildwood Place
- 2814 2814 Springdale Ln
- 0 Clear Springs Dr
- 1108 1108 W Plato Unit 40
- 3402 3402 Thornridge Cir
- 3404 Thornridge Cir
- 3403 Fox Hollow Rd
- 3405 Fox Hollow Rd
- 3407 Fox Hollow Rd
- 3401 Fox Hollow Rd
- 3410 Thornridge Cir
- 3401 Thornridge Cir
- 3409 Fox Hollow Rd
- 3409 3409 Fox Hollow
- 3405 Thornridge Cir
- 1206 Twisted Oaks Dr
- 1204 Twisted Oaks Dr
- 1212 Twisted Oaks Dr
- 3402 Fox Hollow Rd
- 3406 Fox Hollow Rd
- 3301 Fox Hollow Rd
- 1218 Twisted Oaks Dr
- 3410 Fox Hollow Rd
- 3402 Woodknoll