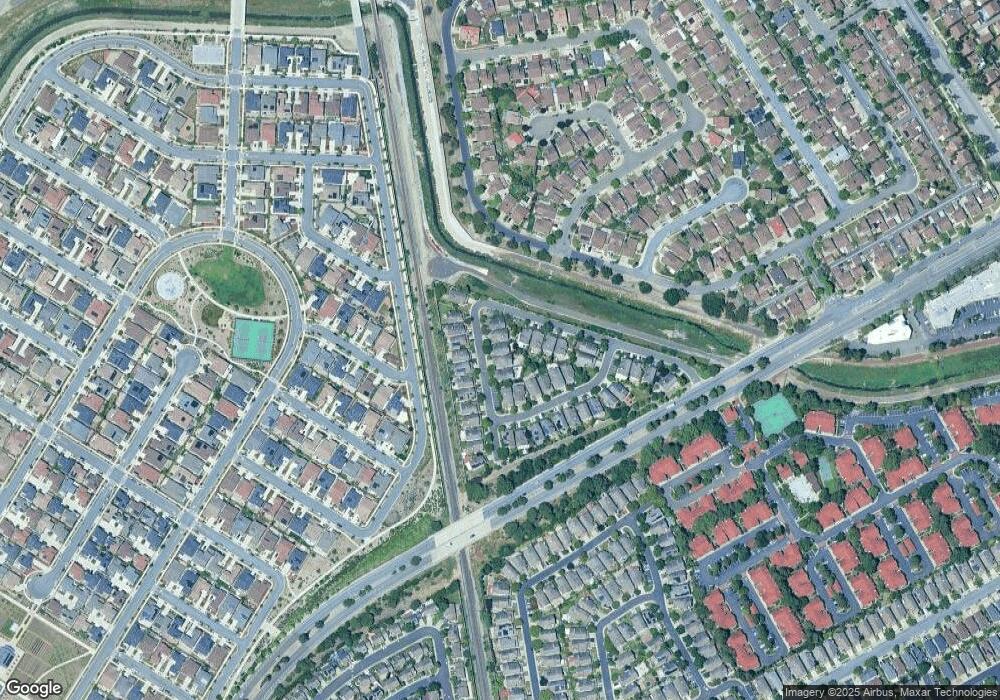
34024 Webfoot Loop Fremont, CA 94555
Ardenwood NeighborhoodEstimated Value: $1,626,468 - $1,817,000
3
Beds
3
Baths
1,686
Sq Ft
$1,006/Sq Ft
Est. Value
About This Home
This home is located at 34024 Webfoot Loop, Fremont, CA 94555 and is currently estimated at $1,696,117, approximately $1,006 per square foot. 34024 Webfoot Loop is a home located in Alameda County with nearby schools including Ardenwood Elementary, Thornton Middle School, and American High School.
Ownership History
Date
Name
Owned For
Owner Type
Purchase Details
Closed on
Jul 14, 2020
Sold by
Kandaswamy Subramaniam and Kelapure Payal
Bought by
Kandaswamy Subramaniam and Kelapure Payal
Current Estimated Value
Home Financials for this Owner
Home Financials are based on the most recent Mortgage that was taken out on this home.
Original Mortgage
$258,000
Outstanding Balance
$182,282
Interest Rate
3.1%
Mortgage Type
New Conventional
Estimated Equity
$1,513,835
Purchase Details
Closed on
May 5, 2017
Sold by
Kandaswamy Subramaniam and Kelapure Payal
Bought by
Kandaswamy Subramaniam and Kelapure Payal
Purchase Details
Closed on
Aug 4, 2011
Sold by
Roashan Bahram R and Roashan Deba
Bought by
Kandaswamy Subramaniam and Kelapure Payal
Home Financials for this Owner
Home Financials are based on the most recent Mortgage that was taken out on this home.
Original Mortgage
$528,000
Outstanding Balance
$363,701
Interest Rate
4.46%
Mortgage Type
New Conventional
Estimated Equity
$1,332,416
Purchase Details
Closed on
May 3, 2001
Sold by
Aziz Ziauddin Mohamed and Aziz Ziauddin Masappath
Bought by
Roashan Bahram R and Roashan Deba
Home Financials for this Owner
Home Financials are based on the most recent Mortgage that was taken out on this home.
Original Mortgage
$485,000
Interest Rate
6.92%
Mortgage Type
Stand Alone First
Purchase Details
Closed on
Aug 27, 1996
Sold by
Ng Sing C and Ng Nung L
Bought by
Aziz Ziauddin Mohamed and Aziz Ziauddin Masarrath
Home Financials for this Owner
Home Financials are based on the most recent Mortgage that was taken out on this home.
Original Mortgage
$216,000
Interest Rate
8%
Create a Home Valuation Report for This Property
The Home Valuation Report is an in-depth analysis detailing your home's value as well as a comparison with similar homes in the area
Home Values in the Area
Average Home Value in this Area
Purchase History
| Date | Buyer | Sale Price | Title Company |
|---|---|---|---|
| Kandaswamy Subramaniam | -- | None Available | |
| Kandaswamy Subramaniam | -- | None Available | |
| Kandaswamy Subramaniam | $660,000 | Chicago Title Company | |
| Roashan Bahram R | $485,000 | Chicago Title Co | |
| Aziz Ziauddin Mohamed | $270,000 | First American Title Guarant |
Source: Public Records
Mortgage History
| Date | Status | Borrower | Loan Amount |
|---|---|---|---|
| Open | Kandaswamy Subramaniam | $258,000 | |
| Open | Kandaswamy Subramaniam | $528,000 | |
| Previous Owner | Roashan Bahram R | $485,000 | |
| Previous Owner | Aziz Ziauddin Mohamed | $216,000 | |
| Closed | Aziz Ziauddin Mohamed | $27,000 |
Source: Public Records
Tax History Compared to Growth
Tax History
| Year | Tax Paid | Tax Assessment Tax Assessment Total Assessment is a certain percentage of the fair market value that is determined by local assessors to be the total taxable value of land and additions on the property. | Land | Improvement |
|---|---|---|---|---|
| 2025 | $10,027 | $828,953 | $248,686 | $580,267 |
| 2024 | $10,027 | $812,703 | $243,811 | $568,892 |
| 2023 | $9,759 | $796,771 | $239,031 | $557,740 |
| 2022 | $9,633 | $781,148 | $234,344 | $546,804 |
| 2021 | $9,398 | $765,837 | $229,751 | $536,086 |
| 2020 | $9,423 | $757,990 | $227,397 | $530,593 |
| 2019 | $9,317 | $743,133 | $222,940 | $520,193 |
| 2018 | $9,136 | $728,567 | $218,570 | $509,997 |
| 2017 | $8,908 | $714,284 | $214,285 | $499,999 |
| 2016 | $8,758 | $700,278 | $210,083 | $490,195 |
| 2015 | $8,642 | $689,765 | $206,929 | $482,836 |
| 2014 | $8,494 | $676,255 | $202,876 | $473,379 |
Source: Public Records
Map
Nearby Homes
- 34198 Tony Terrace
- 34108 Spezia Terrace
- 34192 Firenze Terrace
- 34648 Musk Terrace
- 5220 Fairbanks Common
- 4510 Lodovico Ct
- 34565 Pueblo Terrace
- 34607 Pueblo Terrace
- 34791 Dorado Common
- 33787 Shylock Dr
- 34794 Williams Way
- 4141 Deep Creek Rd Unit 89
- 4141 Deep Creek Rd Unit 106
- 4141 Deep Creek Rd Unit 180
- 34311 Chester Ct
- 4212 Gordon St
- 3863 Milton Terrace
- 4639 Michelle Ct
- 34512 Nantucket Common
- 32533 Regents Blvd
- 34028 Webfoot Loop
- 34020 Webfoot Loop
- 34032 Webfoot Loop
- 34016 Webfoot Loop
- 34012 Webfoot Loop
- 34008 Webfoot Loop
- 34027 Webfoot Loop
- 34031 Webfoot Loop
- 34023 Webfoot Loop
- 34035 Webfoot Loop
- 34019 Webfoot Loop
- 34036 Webfoot Loop
- 34040 Webfoot Loop
- 34004 Webfoot Loop
- 34044 Webfoot Loop
- 34048 Webfoot Loop
- 34039 Webfoot Loop
- 34015 Webfoot Loop
- 34052 Webfoot Loop
- 34000 Webfoot Loop
