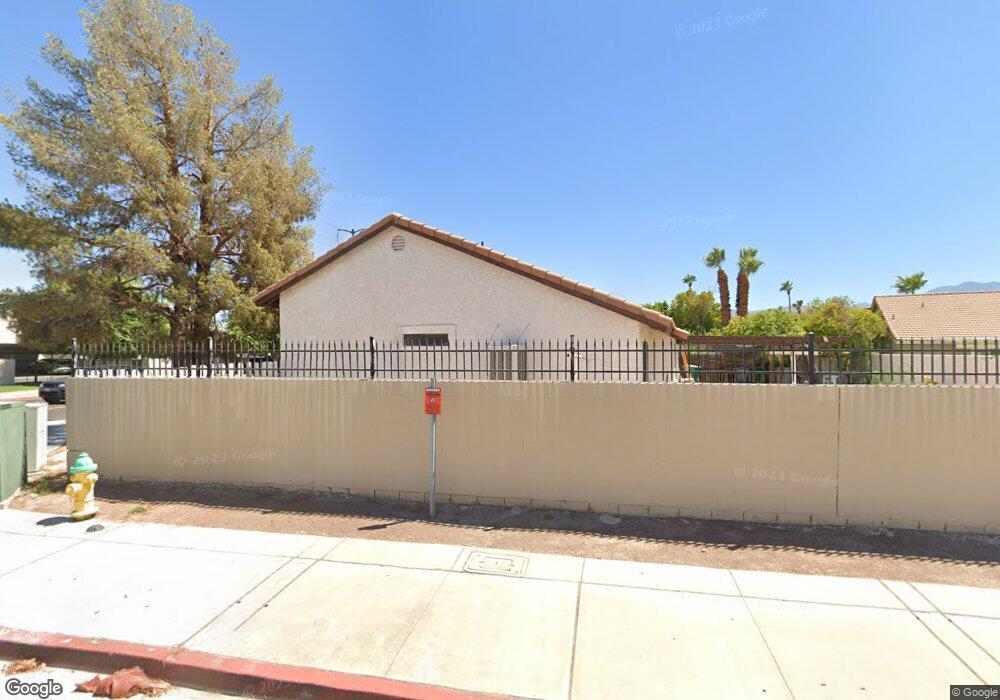
34031 Plumley Rd Cathedral City, CA 92234
Aqua Caliente South NeighborhoodEstimated Value: $437,000 - $480,208
3
Beds
2
Baths
1,334
Sq Ft
$345/Sq Ft
Est. Value
About This Home
This home is located at 34031 Plumley Rd, Cathedral City, CA 92234 and is currently estimated at $460,302, approximately $345 per square foot. 34031 Plumley Rd is a home located in Riverside County with nearby schools including Cathedral City Elementary School, Nellie N. Coffman Middle School, and Cathedral City High School.
Ownership History
Date
Name
Owned For
Owner Type
Purchase Details
Closed on
Jun 3, 2025
Sold by
Bojorquez Juan
Bought by
Bojorquez Juan
Current Estimated Value
Home Financials for this Owner
Home Financials are based on the most recent Mortgage that was taken out on this home.
Original Mortgage
$269,637
Outstanding Balance
$268,945
Interest Rate
6.81%
Mortgage Type
FHA
Estimated Equity
$191,357
Purchase Details
Closed on
Feb 11, 2024
Sold by
Esqueda Cecilia Santana
Bought by
Bojorquez Juan
Purchase Details
Closed on
Sep 27, 2006
Sold by
Couch Kevin R
Bought by
Esqueda Cecilia Santana
Purchase Details
Closed on
Feb 24, 1997
Sold by
James Eychaner and Eychaner Alice E
Bought by
Couch Kevin R and Couch Barbara E
Home Financials for this Owner
Home Financials are based on the most recent Mortgage that was taken out on this home.
Original Mortgage
$79,959
Interest Rate
7.74%
Mortgage Type
FHA
Create a Home Valuation Report for This Property
The Home Valuation Report is an in-depth analysis detailing your home's value as well as a comparison with similar homes in the area
Home Values in the Area
Average Home Value in this Area
Purchase History
| Date | Buyer | Sale Price | Title Company |
|---|---|---|---|
| Bojorquez Juan | -- | Orange Coast Title | |
| Bojorquez Juan | -- | None Listed On Document | |
| Esqueda Cecilia Santana | $305,000 | Southland Title Company | |
| Couch Kevin R | $80,000 | Chicago Title Co |
Source: Public Records
Mortgage History
| Date | Status | Borrower | Loan Amount |
|---|---|---|---|
| Open | Bojorquez Juan | $269,637 | |
| Previous Owner | Couch Kevin R | $79,959 |
Source: Public Records
Tax History Compared to Growth
Tax History
| Year | Tax Paid | Tax Assessment Tax Assessment Total Assessment is a certain percentage of the fair market value that is determined by local assessors to be the total taxable value of land and additions on the property. | Land | Improvement |
|---|---|---|---|---|
| 2025 | $2,382 | $430,439 | $107,611 | $322,828 |
| 2023 | $2,382 | $133,620 | $33,400 | $100,220 |
| 2022 | $2,255 | $131,001 | $32,746 | $98,255 |
| 2021 | $2,166 | $128,433 | $32,104 | $96,329 |
| 2020 | $2,058 | $127,117 | $31,775 | $95,342 |
| 2019 | $2,011 | $124,625 | $31,152 | $93,473 |
| 2018 | $1,957 | $122,183 | $30,542 | $91,641 |
| 2017 | $1,918 | $119,789 | $29,944 | $89,845 |
| 2016 | $1,865 | $117,441 | $29,357 | $88,084 |
| 2015 | $1,803 | $115,679 | $28,917 | $86,762 |
| 2014 | $1,786 | $113,414 | $28,351 | $85,063 |
Source: Public Records
Map
Nearby Homes
- 34061 Plumley Rd
- 34354 Laura Way
- 34071 Denise Way
- 34341 Denise Way
- 34090 Denise Way
- 105 Shoreline Dr
- 7 Lake Como Ct
- 64 Via Santo Tomas
- 35070 Maria Rd
- 8 Via Santa Ramona
- 69360 Vera Dr
- 65 Shoreline Dr
- 5 Lake Louise Ct
- 69727 Camino Pacifico
- 497 Prairie
- 37 Shoreline Dr
- 392 Standing Bear
- 40 Shoreline Dr
- 69767 Camino Pacifico
- 25 Via Santo Tomas
- 34005 Suncrest Dr
- 34005 Suncrest Cir
- 34017 Suncrest Dr
- 34093 Plumley Rd
- 34006 Suncrest Dr
- 34029 Suncrest Dr
- 34125 Plumley Rd
- 34018 Suncrest Dr
- 34041 Suncrest Dr
- 34030 Suncrest Dr
- 69480 Bion Way
- 69466 Bion Way
- 34025 Rebecca Way
- 69454 Bion Way
- 34053 Suncrest Dr
- 34067 Suncrest Dr
- 69442 Bion Way
- 34099 Suncrest Dr
- 34127 Suncrest Dr
- 34100 Linda Way