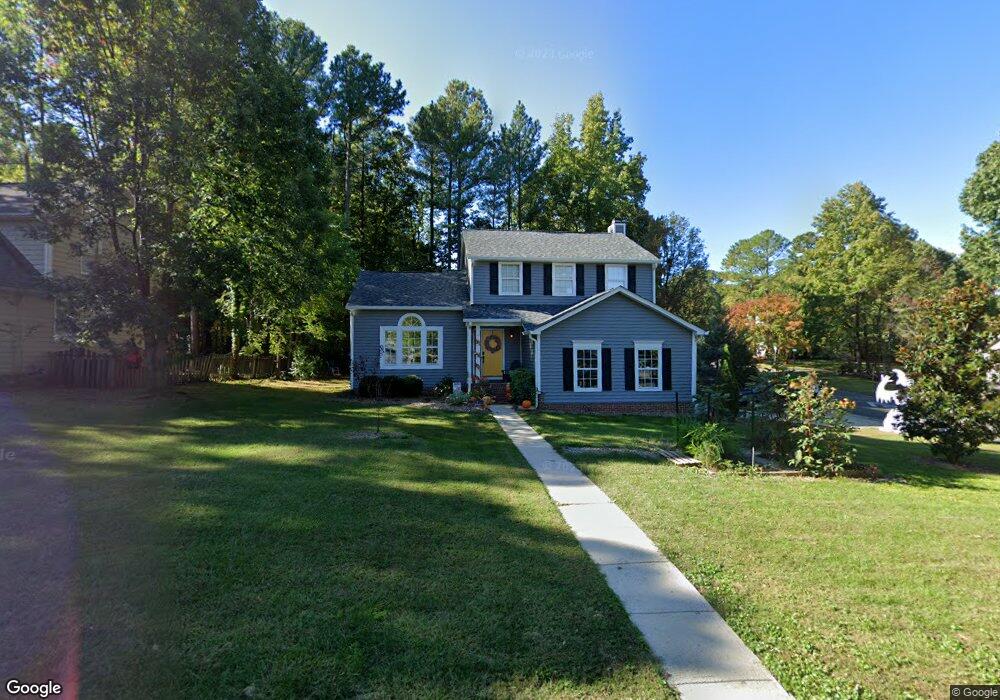
3404 Appling Way Durham, NC 27703
South Durham NeighborhoodEstimated Value: $413,834 - $440,000
3
Beds
3
Baths
1,670
Sq Ft
$255/Sq Ft
Est. Value
About This Home
This home is located at 3404 Appling Way, Durham, NC 27703 and is currently estimated at $425,959, approximately $255 per square foot. 3404 Appling Way is a home located in Durham County with nearby schools including Bethesda Elementary School, John W Neal Middle School, and Southern School of Energy & Sustainability.
Ownership History
Date
Name
Owned For
Owner Type
Purchase Details
Closed on
Jan 25, 2016
Sold by
Stephenson Timothy L
Bought by
Parks Joseph S and Parks Lindsey G
Current Estimated Value
Home Financials for this Owner
Home Financials are based on the most recent Mortgage that was taken out on this home.
Original Mortgage
$168,000
Outstanding Balance
$134,316
Interest Rate
4.04%
Mortgage Type
New Conventional
Estimated Equity
$291,643
Purchase Details
Closed on
Mar 19, 2015
Sold by
Equicredit Corp Of America
Bought by
Stephenson Tim
Purchase Details
Closed on
Sep 16, 2014
Sold by
Johnson Everett and Johnson Freda
Bought by
Equicredit Corp
Purchase Details
Closed on
Sep 3, 1998
Sold by
Maynard Randale L and Maynard Vickii S
Bought by
Johnson Everett
Home Financials for this Owner
Home Financials are based on the most recent Mortgage that was taken out on this home.
Original Mortgage
$130,050
Interest Rate
6.92%
Create a Home Valuation Report for This Property
The Home Valuation Report is an in-depth analysis detailing your home's value as well as a comparison with similar homes in the area
Home Values in the Area
Average Home Value in this Area
Purchase History
| Date | Buyer | Sale Price | Title Company |
|---|---|---|---|
| Parks Joseph S | $210,000 | -- | |
| Stephenson Tim | $138,000 | None Available | |
| Equicredit Corp | $127,600 | None Available | |
| Johnson Everett | $130,500 | -- |
Source: Public Records
Mortgage History
| Date | Status | Borrower | Loan Amount |
|---|---|---|---|
| Open | Parks Joseph S | $168,000 | |
| Previous Owner | Johnson Everett | $130,050 |
Source: Public Records
Tax History
| Year | Tax Paid | Tax Assessment Tax Assessment Total Assessment is a certain percentage of the fair market value that is determined by local assessors to be the total taxable value of land and additions on the property. | Land | Improvement |
|---|---|---|---|---|
| 2025 | $4,220 | $425,747 | $128,100 | $297,647 |
| 2024 | $3,303 | $236,803 | $48,800 | $188,003 |
| 2023 | $3,102 | $236,803 | $48,800 | $188,003 |
| 2022 | $3,031 | $236,803 | $48,800 | $188,003 |
| 2021 | $3,017 | $236,803 | $48,800 | $188,003 |
| 2020 | $2,946 | $236,803 | $48,800 | $188,003 |
| 2019 | $2,946 | $236,803 | $48,800 | $188,003 |
| 2018 | $2,732 | $201,381 | $36,600 | $164,781 |
| 2017 | $2,712 | $201,381 | $36,600 | $164,781 |
| 2016 | $2,620 | $201,381 | $36,600 | $164,781 |
| 2015 | $2,756 | $199,078 | $39,373 | $159,705 |
| 2014 | $2,756 | $199,078 | $39,373 | $159,705 |
Source: Public Records
Map
Nearby Homes
- 3503 Long Ridge Rd
- 2701 Skybrook Ln
- 12 Sameer Ct
- 334 Westgrove Ct
- 19 Gandhi Dr
- 5226 Malik Dr
- 107 Vickery Hill Ct
- 5216 Dilbagh Dr
- 2214 Tw Alexander Dr
- 231 Westgrove Ct
- 2216 Jollay St
- 4512 Brimmer St
- 5024 Dragonfly Dr
- Ashland Plan at
- Cary Plan at
- Norman Plan at
- Bristol Plan at
- 106 Torrey Heights Ln
- 2709 Hamilton Green Dr
- 136 Torrey Heights Ln
- 102 Blue Ridge Ct
- 2 Home Croft Ct
- 106 Blue Ridge Ct
- 101 Blue Ridge Ct
- 3318 Appling Way
- 103 Blue Ridge Ct
- 3407 Appling Way
- 108 Blue Ridge Ct
- 4 Home Croft Ct
- 3 Indian Head Ct
- 107 Blue Ridge Ct
- 5018 Rolling Meadows Dr
- 3317 Appling Way
- 3316 Appling Way
- 5117 Huxey Glenn Ct
- 5115 Huxey Glenn Ct
- 110 Blue Ridge Ct
- 3 Seville Ct
- 6 Home Croft Ct
- 5 Indian Head Ct
Your Personal Tour Guide
Ask me questions while you tour the home.