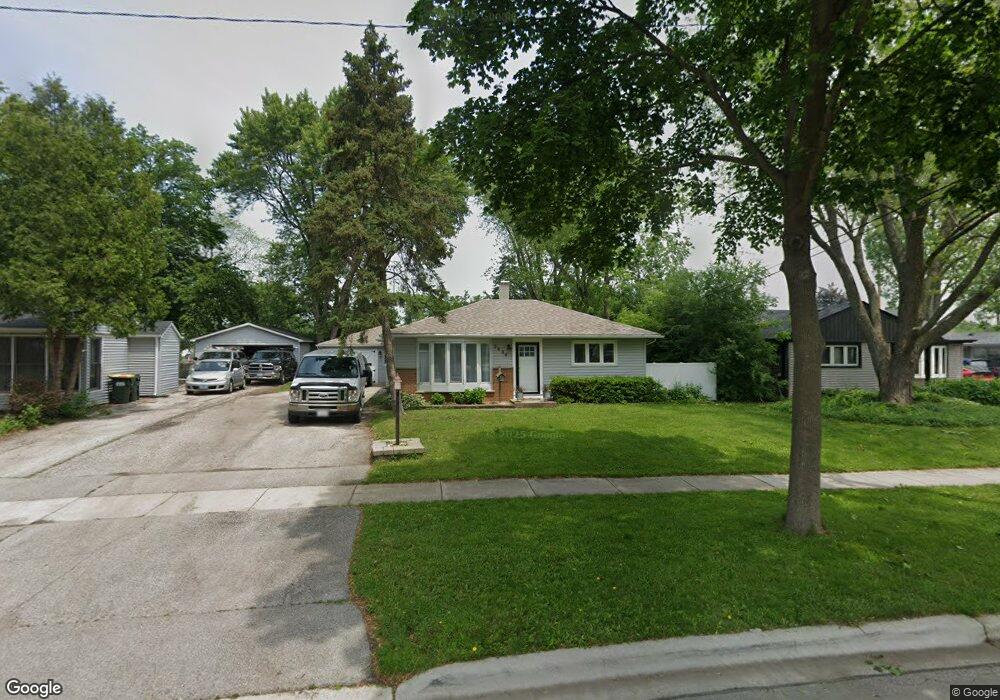
3404 Peacock Ln Rolling Meadows, IL 60008
Estimated Value: $321,000 - $363,000
3
Beds
2
Baths
1,197
Sq Ft
$288/Sq Ft
Est. Value
About This Home
This home is located at 3404 Peacock Ln, Rolling Meadows, IL 60008 and is currently estimated at $345,172, approximately $288 per square foot. 3404 Peacock Ln is a home located in Cook County with nearby schools including Willow Bend Elementary School, Carl Sandburg Junior High School, and Rolling Meadows High School.
Ownership History
Date
Name
Owned For
Owner Type
Purchase Details
Closed on
Feb 2, 2015
Sold by
Falendysz Andrzej
Bought by
Falendysz Andrzej and Falendysz Voytek
Current Estimated Value
Home Financials for this Owner
Home Financials are based on the most recent Mortgage that was taken out on this home.
Original Mortgage
$202,500
Outstanding Balance
$156,540
Interest Rate
4.25%
Mortgage Type
New Conventional
Estimated Equity
$188,632
Purchase Details
Closed on
Jun 19, 2009
Sold by
Milewski Timothy
Bought by
Falendysz Andrzej and Falendysz Bogumila
Purchase Details
Closed on
Mar 26, 2007
Sold by
Milewski Barbara A
Bought by
Milewski Barbara and Barbara Milewski Trust
Create a Home Valuation Report for This Property
The Home Valuation Report is an in-depth analysis detailing your home's value as well as a comparison with similar homes in the area
Home Values in the Area
Average Home Value in this Area
Purchase History
| Date | Buyer | Sale Price | Title Company |
|---|---|---|---|
| Falendysz Andrzej | -- | Stewart Title | |
| Falendysz Andrzej | -- | Stewart Title | |
| Falendysz Andrzej | $224,250 | Chicago Title Insurance Co | |
| Milewski Barbara | -- | None Available |
Source: Public Records
Mortgage History
| Date | Status | Borrower | Loan Amount |
|---|---|---|---|
| Open | Falendysz Andrzej | $202,500 |
Source: Public Records
Tax History
| Year | Tax Paid | Tax Assessment Tax Assessment Total Assessment is a certain percentage of the fair market value that is determined by local assessors to be the total taxable value of land and additions on the property. | Land | Improvement |
|---|---|---|---|---|
| 2025 | $6,339 | $28,000 | $5,920 | $22,080 |
| 2024 | $6,339 | $24,000 | $5,009 | $18,991 |
| 2023 | $6,040 | $24,000 | $5,009 | $18,991 |
| 2022 | $6,040 | $24,000 | $5,009 | $18,991 |
| 2021 | $4,883 | $18,076 | $2,960 | $15,116 |
| 2020 | $4,842 | $18,076 | $2,960 | $15,116 |
| 2019 | $4,878 | $20,197 | $2,960 | $17,237 |
| 2018 | $5,602 | $20,731 | $2,732 | $17,999 |
| 2017 | $5,913 | $22,010 | $2,732 | $19,278 |
| 2016 | $5,768 | $22,010 | $2,732 | $19,278 |
| 2015 | $4,922 | $18,256 | $2,504 | $15,752 |
| 2014 | $4,821 | $18,256 | $2,504 | $15,752 |
| 2013 | $4,687 | $18,256 | $2,504 | $15,752 |
Source: Public Records
Map
Nearby Homes
- 3200 Thrush Ln
- 3710 Meadow Dr
- 399 Knollwood Ct
- 3712 Jay Ln
- 3135 Town Square Dr Unit 401
- 3135 Town Square Dr Unit 104
- 3345 Kirchoff Rd Unit 5C
- 3209 Trillium Cir
- 3306 Trillium Cir Unit 3001
- 3265 Kirchoff Rd Unit 116
- 2709 Lily Ln
- 3100 Town Square Dr Unit 308
- 3100 Town Square Dr Unit 204
- 2302 Fulle St
- 3605 Oriole Ln
- 5001 Carriageway Dr Unit 215
- 5000 Carriageway Dr Unit 305
- 5000 Carriageway Dr Unit 315
- 4980 Kimball Hill Dr Unit C2
- 2504 Algonquin Rd Unit 14
- 3402 Peacock Ln
- 3406 Peacock Ln
- 3400 Peacock Ln
- 3408 Peacock Ln
- 3310 Peacock Ln
- 3405 Peacock Ln
- 3403 Peacock Ln
- 3410 Peacock Ln
- 4201 Peacock Ct
- 4008 Owl Dr
- 3308 Peacock Ln
- 3407 Peacock Ln
- 4006 Owl Dr
- 4104 Owl Dr
- 3306 Peacock Ln
- 4203 Peacock Ct
- 4106 Owl Dr
- 4004 Owl Dr
- 4200 Peacock Ct Unit 12
- 3304 Peacock Ln
Your Personal Tour Guide
Ask me questions while you tour the home.