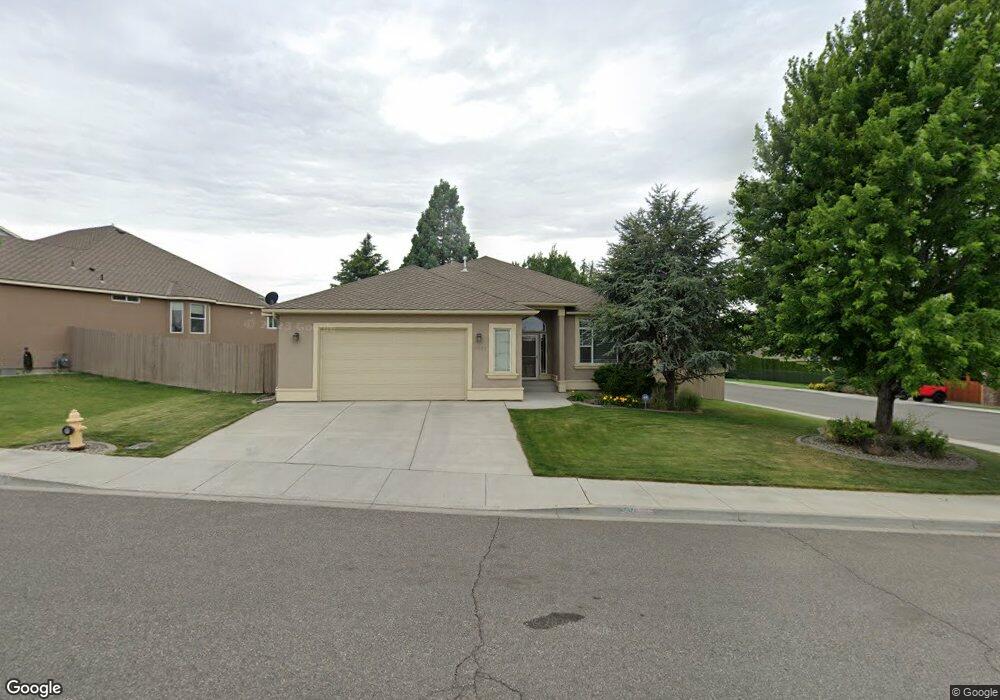
3404 S Johnson St Unit 1 owner home, barely Kennewick, WA 99337
Canyon Lakes NeighborhoodEstimated Value: $531,056 - $625,000
4
Beds
2
Baths
2,150
Sq Ft
$272/Sq Ft
Est. Value
About This Home
This home is located at 3404 S Johnson St Unit 1 owner home, barely, Kennewick, WA 99337 and is currently estimated at $584,014, approximately $271 per square foot. 3404 S Johnson St Unit 1 owner home, barely is a home located in Benton County with nearby schools including Sagecrest Elementary School, Southridge High School, and Bethlehem Lutheran School.
Ownership History
Date
Name
Owned For
Owner Type
Purchase Details
Closed on
Jun 2, 2016
Sold by
Saarem Donna T and Gant Timothy T
Bought by
Hendricks Christine E
Current Estimated Value
Home Financials for this Owner
Home Financials are based on the most recent Mortgage that was taken out on this home.
Original Mortgage
$449,850
Outstanding Balance
$370,518
Interest Rate
4.69%
Mortgage Type
Reverse Mortgage Home Equity Conversion Mortgage
Estimated Equity
$213,496
Purchase Details
Closed on
Jul 14, 2011
Sold by
Sr Homes Llc
Bought by
Saarem Donna T
Home Financials for this Owner
Home Financials are based on the most recent Mortgage that was taken out on this home.
Original Mortgage
$256,405
Interest Rate
4.5%
Mortgage Type
New Conventional
Purchase Details
Closed on
Jan 4, 2011
Sold by
T R Masterson Construction Of Washington
Bought by
Sr Homes Llc
Create a Home Valuation Report for This Property
The Home Valuation Report is an in-depth analysis detailing your home's value as well as a comparison with similar homes in the area
Home Values in the Area
Average Home Value in this Area
Purchase History
| Date | Buyer | Sale Price | Title Company |
|---|---|---|---|
| Hendricks Christine E | $299,900 | Stewart Title Company | |
| Saarem Donna T | $269,900 | Cascade Title | |
| Sr Homes Llc | $350,000 | Chicago Title |
Source: Public Records
Mortgage History
| Date | Status | Borrower | Loan Amount |
|---|---|---|---|
| Open | Hendricks Christine E | $449,850 | |
| Previous Owner | Saarem Donna T | $256,405 |
Source: Public Records
Tax History Compared to Growth
Tax History
| Year | Tax Paid | Tax Assessment Tax Assessment Total Assessment is a certain percentage of the fair market value that is determined by local assessors to be the total taxable value of land and additions on the property. | Land | Improvement |
|---|---|---|---|---|
| 2024 | $553 | $332,500 | $60,000 | $272,500 |
| 2023 | $553 | $332,500 | $60,000 | $272,500 |
| 2022 | $687 | $332,500 | $60,000 | $272,500 |
| 2021 | $744 | $332,500 | $60,000 | $272,500 |
| 2020 | $3,496 | $354,300 | $60,000 | $294,300 |
| 2019 | $3,196 | $332,500 | $60,000 | $272,500 |
| 2018 | $3,494 | $310,700 | $60,000 | $250,700 |
| 2017 | $2,881 | $278,000 | $60,000 | $218,000 |
| 2016 | $3,213 | $249,240 | $60,000 | $189,240 |
| 2015 | $3,228 | $249,240 | $60,000 | $189,240 |
| 2014 | -- | $249,240 | $60,000 | $189,240 |
| 2013 | -- | $249,240 | $60,000 | $189,240 |
Source: Public Records
Map
Nearby Homes
- 3410 S Johnson St
- 3416 S Irby St
- 3610 S Johnson St
- 3504 W 34th Ave
- 3101 W 34th Ave
- 3411 S Morain St
- 3406 S Huntington Loop
- 3121 W 30th Ave Unit G-101
- 3121 W 30th Ave Unit L 102
- 3516 S Fisher Ct
- 2922 S Ledbetter Place
- 3614 S Green St
- 2804 S Huntington Ct
- 316 W Canyon Lakes Dr
- 320 W Canyon Lakes Dr
- 3435 S Dennis St
- 3008 S Neel Place
- 3710 W Canyon Lakes Dr Unit F-104
- 3710 W Canyon Lakes Dr
- 3906 S Morain Loop
- 3404 S Johnson St
- 3403 S Keller St
- 3414 S Johnson St
- 3405 S Johnson St
- 3409 S Johnson St Unit Right on the Golf Co
- 3409 S Johnson St Unit RARE CANYON LAKES GO
- 3409 S Johnson St
- 3407 S Keller St
- 3300 W 34th Ave
- 3401 S Johnson St
- 3413 S Johnson St
- 3312 W 34th Ave
- 3417 S Johnson St Unit CRAFTSMEN STYLE/GOLF
- 3417 S Johnson St Unit GOLF COURSE FRONTAGE
- 3417 S Johnson St
- 3403 W 34th Ave
- 3402 W 34th Ave
- 3504 S Johnson St
- 3501 S Johnson St
- 3505 S Keller St Unit Updated, Like new mo