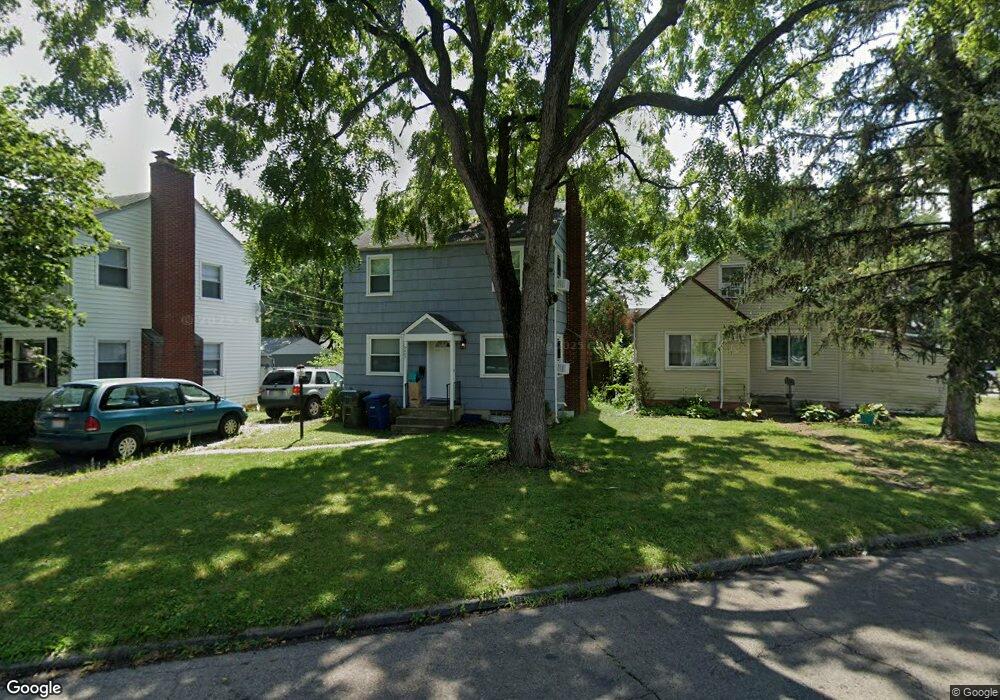
3407 Camp Chase Dr Columbus, OH 43204
Westgate NeighborhoodEstimated Value: $181,242 - $248,000
3
Beds
1
Bath
1,008
Sq Ft
$198/Sq Ft
Est. Value
About This Home
This home is located at 3407 Camp Chase Dr, Columbus, OH 43204 and is currently estimated at $199,811, approximately $198 per square foot. 3407 Camp Chase Dr is a home located in Franklin County with nearby schools including Westgate Alternative Elementary School, Westmoor Middle School, and West High School.
Ownership History
Date
Name
Owned For
Owner Type
Purchase Details
Closed on
Jan 20, 2010
Sold by
Secretary Of Housing & Urban Development
Bought by
Ranshaw Carl and Ranshaw Kathy
Current Estimated Value
Purchase Details
Closed on
Jul 7, 2009
Sold by
Colonial National Mortgage
Bought by
Secretary Of Housing & Urban Development
Purchase Details
Closed on
Jun 29, 2009
Sold by
Clay David G and Case #08Cve 09 12745
Bought by
Colonial National Mortgage
Purchase Details
Closed on
Aug 2, 2001
Sold by
Love John F and Love Erma E
Bought by
Clay David G
Home Financials for this Owner
Home Financials are based on the most recent Mortgage that was taken out on this home.
Original Mortgage
$73,283
Interest Rate
7.23%
Mortgage Type
FHA
Purchase Details
Closed on
Aug 14, 1992
Bought by
Love John F & Erma E
Purchase Details
Closed on
Jun 1, 1987
Create a Home Valuation Report for This Property
The Home Valuation Report is an in-depth analysis detailing your home's value as well as a comparison with similar homes in the area
Home Values in the Area
Average Home Value in this Area
Purchase History
| Date | Buyer | Sale Price | Title Company |
|---|---|---|---|
| Ranshaw Carl | $17,650 | Talon Group | |
| Secretary Of Housing & Urban Development | -- | Attorney | |
| Colonial National Mortgage | $50,000 | None Available | |
| Clay David G | $73,900 | Title First Agency Inc | |
| Love John F & Erma E | $49,100 | -- | |
| -- | $45,900 | -- |
Source: Public Records
Mortgage History
| Date | Status | Borrower | Loan Amount |
|---|---|---|---|
| Previous Owner | Clay David G | $73,283 |
Source: Public Records
Tax History Compared to Growth
Tax History
| Year | Tax Paid | Tax Assessment Tax Assessment Total Assessment is a certain percentage of the fair market value that is determined by local assessors to be the total taxable value of land and additions on the property. | Land | Improvement |
|---|---|---|---|---|
| 2024 | $4,024 | $57,160 | $17,680 | $39,480 |
| 2023 | $2,587 | $57,160 | $17,680 | $39,480 |
| 2022 | $1,780 | $33,010 | $5,670 | $27,340 |
| 2021 | $1,757 | $33,010 | $5,670 | $27,340 |
| 2020 | $1,895 | $33,010 | $5,670 | $27,340 |
| 2019 | $1,708 | $27,240 | $4,730 | $22,510 |
| 2018 | $1,722 | $27,240 | $4,730 | $22,510 |
| 2017 | $1,693 | $27,240 | $4,730 | $22,510 |
| 2016 | $1,913 | $23,950 | $4,450 | $19,500 |
| 2015 | $1,481 | $23,950 | $4,450 | $19,500 |
| 2014 | $1,485 | $23,950 | $4,450 | $19,500 |
| 2013 | $771 | $25,200 | $4,690 | $20,510 |
Source: Public Records
Map
Nearby Homes
- 30 Demorest Rd
- 43 Letchworth Ave
- 79 S Southampton Ave
- 195 S Sylvan Ave
- 56 Broadlawn Ave
- 32 Orel Ave
- 36-38 Orel Ave
- 253 Powhatan Ave
- 133 S Brinker Ave
- 328 S Southampton Ave
- 160 N Sylvan Ave
- 66 N Brinker Ave
- 3096 Ellis Place
- 113 N Brinker Ave Unit 115
- 180 N Sylvan Ave
- 0 S Brinker Ave
- 119 N Westgate Ave
- 267 S Westgate Ave
- 3100 Steele Ave
- 164 Alice Rita St
- 3403 Camp Chase Dr
- 3413 Camp Chase Dr
- 66 Derrer Rd
- 49 Demorest Rd
- 43 Demorest Rd
- 55 Demorest Ave
- 63 Demorest Rd
- 63 Demorest Ave
- 35 Demorest Rd
- 72 Derrer Rd Unit 74
- 35 Demorest Ave
- 69 Demorest Rd
- 69 Demorest Ave
- 3398 Camp Chase Dr
- 3396-3398 Camp Chase Dr
- 3396-3398 Camp Chase Dr Unit 398
- 78 Derrer Rd Unit 80
- 78-80 Derrer Rd
- 3396 Camp Chase Dr Unit 398
- 3396 Camp Chase Dr Unit 8