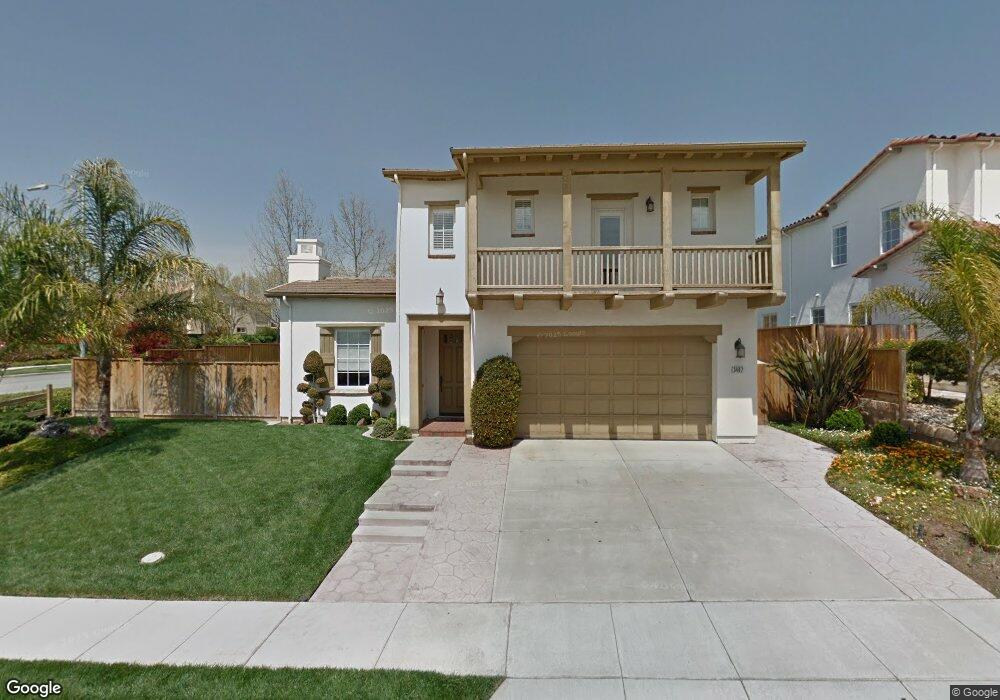
3407 Eldiva Ct San Jose, CA 95148
Murillo NeighborhoodEstimated Value: $2,509,173 - $2,694,000
4
Beds
3
Baths
2,763
Sq Ft
$938/Sq Ft
Est. Value
About This Home
This home is located at 3407 Eldiva Ct, San Jose, CA 95148 and is currently estimated at $2,591,793, approximately $938 per square foot. 3407 Eldiva Ct is a home located in Santa Clara County with nearby schools including Carolyn A. Clark Elementary School, Quimby Oak Middle School, and Evergreen Valley High School.
Ownership History
Date
Name
Owned For
Owner Type
Purchase Details
Closed on
Aug 26, 2005
Sold by
Shimamoto Kirk Y
Bought by
Cruz Connie
Current Estimated Value
Home Financials for this Owner
Home Financials are based on the most recent Mortgage that was taken out on this home.
Original Mortgage
$580,000
Outstanding Balance
$212,948
Interest Rate
1%
Mortgage Type
Negative Amortization
Estimated Equity
$2,378,845
Purchase Details
Closed on
Jul 17, 2003
Sold by
Shapell Industries Inc
Bought by
Shimamoto Kirk Y
Home Financials for this Owner
Home Financials are based on the most recent Mortgage that was taken out on this home.
Original Mortgage
$613,335
Interest Rate
3.87%
Mortgage Type
Purchase Money Mortgage
Purchase Details
Closed on
Jul 14, 2003
Sold by
Shimamoto Darlene Ann
Bought by
Shimamoto Kirk Y
Home Financials for this Owner
Home Financials are based on the most recent Mortgage that was taken out on this home.
Original Mortgage
$613,335
Interest Rate
3.87%
Mortgage Type
Purchase Money Mortgage
Create a Home Valuation Report for This Property
The Home Valuation Report is an in-depth analysis detailing your home's value as well as a comparison with similar homes in the area
Home Values in the Area
Average Home Value in this Area
Purchase History
| Date | Buyer | Sale Price | Title Company |
|---|---|---|---|
| Cruz Connie | $1,180,000 | Old Republic Title Company | |
| Cruz Connie | -- | Old Republic Title Company | |
| Shimamoto Kirk Y | $767,000 | Alliance Title Company | |
| Shimamoto Kirk Y | -- | Alliance Title Company |
Source: Public Records
Mortgage History
| Date | Status | Borrower | Loan Amount |
|---|---|---|---|
| Open | Cruz Connie | $580,000 | |
| Previous Owner | Shimamoto Kirk Y | $613,335 | |
| Closed | Shimamoto Kirk Y | $76,668 |
Source: Public Records
Tax History Compared to Growth
Tax History
| Year | Tax Paid | Tax Assessment Tax Assessment Total Assessment is a certain percentage of the fair market value that is determined by local assessors to be the total taxable value of land and additions on the property. | Land | Improvement |
|---|---|---|---|---|
| 2025 | $22,417 | $1,612,554 | $1,128,792 | $483,762 |
| 2024 | $22,417 | $1,580,936 | $1,106,659 | $474,277 |
| 2023 | $22,016 | $1,549,938 | $1,084,960 | $464,978 |
| 2022 | $21,888 | $1,519,548 | $1,063,687 | $455,861 |
| 2021 | $21,563 | $1,489,754 | $1,042,831 | $446,923 |
| 2020 | $20,671 | $1,474,480 | $1,032,139 | $442,341 |
| 2019 | $20,170 | $1,445,569 | $1,011,901 | $433,668 |
| 2018 | $20,009 | $1,417,225 | $992,060 | $425,165 |
| 2017 | $19,690 | $1,389,437 | $972,608 | $416,829 |
| 2016 | $18,786 | $1,362,194 | $953,538 | $408,656 |
| 2015 | $18,544 | $1,341,733 | $939,215 | $402,518 |
| 2014 | $16,572 | $1,244,000 | $870,800 | $373,200 |
Source: Public Records
Map
Nearby Homes
- 3424 Maroun Place
- 3963 Mosher Dr
- 4182 Lautrec Dr
- 3301 Villa Contessa Ct
- 3858 Evangelho Cir
- 3210 La Rochelle Way
- 3040 Cedar Ridge Ct
- 3668 Summit Ridge Ct
- 4117 Pinot Gris Way
- 2984 Springbrook Ct
- 3205 Gateland Ct
- 3530 Jasmine Cir
- 2834 White Acres Dr
- 3343 Quesada Dr
- 2855 Weyers Ct
- 2715 Millbrae Way
- 2630 Raritan Place
- 4393 Quimby Rd
- 2822 Rainwood Ct
- 2652 Orinda Dr
- 3413 Eldiva Ct
- 3698 Rue Mirassou
- 3425 Eldiva Ct
- 3692 Rue Mirassou
- 3359 Louis Paul Way
- 3406 Eldiva Ct
- 3412 Eldiva Ct
- 3418 Eldiva Ct
- 3704 Rue Mirassou
- 3360 Louis Paul Way
- 3424 Eldiva Ct
- 3347 Louis Paul Way
- 3354 Louis Paul Way
- 3405 Piemonte Ct
- 3430 Eldiva Ct
- 3708 Rue Mirassou
- 3411 Piemonte Ct
- 3501 Jonathan Rachelle Ct
- 3417 Piemonte Ct
- 3361 Moncucco Way