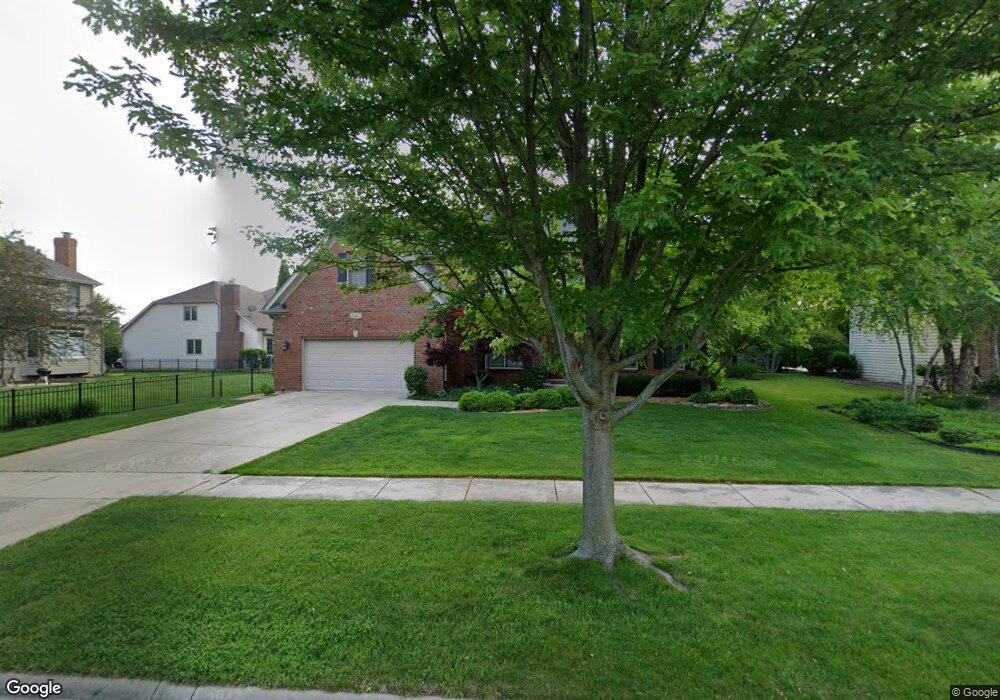
3407 Vanilla Grass Dr Unit 2 Naperville, IL 60564
Tall Grass NeighborhoodEstimated Value: $809,267 - $869,000
Studio
1
Bath
2,996
Sq Ft
$282/Sq Ft
Est. Value
About This Home
This home is located at 3407 Vanilla Grass Dr Unit 2, Naperville, IL 60564 and is currently estimated at $845,067, approximately $282 per square foot. 3407 Vanilla Grass Dr Unit 2 is a home located in Will County with nearby schools including Fry Elementary School, Scullen Middle School, and Waubonsie Valley High School.
Ownership History
Date
Name
Owned For
Owner Type
Purchase Details
Closed on
Feb 25, 2002
Sold by
Tower Homes Inc
Bought by
Sikorski Ron M and Sikorski Cindy B
Current Estimated Value
Home Financials for this Owner
Home Financials are based on the most recent Mortgage that was taken out on this home.
Original Mortgage
$200,000
Outstanding Balance
$83,839
Interest Rate
7.11%
Estimated Equity
$761,228
Purchase Details
Closed on
Jul 20, 2000
Sold by
Maf Developments Inc
Bought by
Tower Homes Inc
Home Financials for this Owner
Home Financials are based on the most recent Mortgage that was taken out on this home.
Original Mortgage
$77,950
Interest Rate
8.19%
Mortgage Type
Construction
Create a Home Valuation Report for This Property
The Home Valuation Report is an in-depth analysis detailing your home's value as well as a comparison with similar homes in the area
Home Values in the Area
Average Home Value in this Area
Purchase History
| Date | Buyer | Sale Price | Title Company |
|---|---|---|---|
| Sikorski Ron M | $442,000 | Chicago Title Insurance Co | |
| Tower Homes Inc | $104,000 | Chicago Title Insurance Co |
Source: Public Records
Mortgage History
| Date | Status | Borrower | Loan Amount |
|---|---|---|---|
| Open | Sikorski Ron M | $200,000 | |
| Previous Owner | Tower Homes Inc | $77,950 |
Source: Public Records
Tax History
| Year | Tax Paid | Tax Assessment Tax Assessment Total Assessment is a certain percentage of the fair market value that is determined by local assessors to be the total taxable value of land and additions on the property. | Land | Improvement |
|---|---|---|---|---|
| 2024 | $15,064 | $245,983 | $66,332 | $179,651 |
| 2023 | $15,064 | $217,299 | $58,597 | $158,702 |
| 2022 | $13,412 | $191,120 | $55,432 | $135,688 |
| 2021 | $12,821 | $182,019 | $52,792 | $129,227 |
| 2020 | $12,578 | $179,135 | $51,956 | $127,179 |
| 2019 | $12,364 | $174,087 | $50,492 | $123,595 |
| 2018 | $11,583 | $160,620 | $49,381 | $111,239 |
| 2017 | $11,406 | $156,473 | $48,106 | $108,367 |
| 2016 | $11,385 | $153,104 | $47,070 | $106,034 |
| 2015 | $11,928 | $147,216 | $45,260 | $101,956 |
| 2014 | $11,928 | $151,010 | $45,260 | $105,750 |
| 2013 | $11,928 | $151,010 | $45,260 | $105,750 |
Source: Public Records
Map
Nearby Homes
- 3807 Landsdown Ave
- 24531 W 103rd St
- 3432 Redwing Dr Unit 2
- 3307 Danlaur Ct Unit 6
- 3816 Grassmere Rd
- 3907 Littlestone Cir
- 2905 Normandy Cir
- 3258 Mirehaven Ct
- 3274 Mirehaven Ct
- 3740 Idlewild Ln
- 3273 Mirehaven Dr
- 3021 Saganashkee Ln
- 3218 Lincoln Prairie Blvd
- 2904 Portage St
- 9836 S Carls Dr
- 3281 Cool Springs Ct
- 3338 Fulshear Cir
- 3060 Crystal Rock Rd
- 3975 Idlewild Ln Unit 107
- 3451 Parliament Ln
- 3903 Landsdown Ave
- 3908 Mistflower Ln Unit 2
- 3907 Landsdown Ave
- 3403 Vanilla Grass Dr
- 3911 Landsdown Ave
- 3836 Mistflower Ln
- 3815 Landsdown Ave
- 3912 Mistflower Ln
- 3915 Landsdown Ave
- 3832 Mistflower Ln
- 3907 Mistflower Ln
- 3811 Landsdown Ave
- 3903 Mistflower Ln
- 3911 Mistflower Ln
- 3919 Mistflower Ct
- 3908 Landsdown Ave Unit 2
- 3904 Landsdown Ave
- 3916 Mistflower Ln
- 3839 Mistflower Ln
- 3919 Landsdown Ave
Your Personal Tour Guide
Ask me questions while you tour the home.