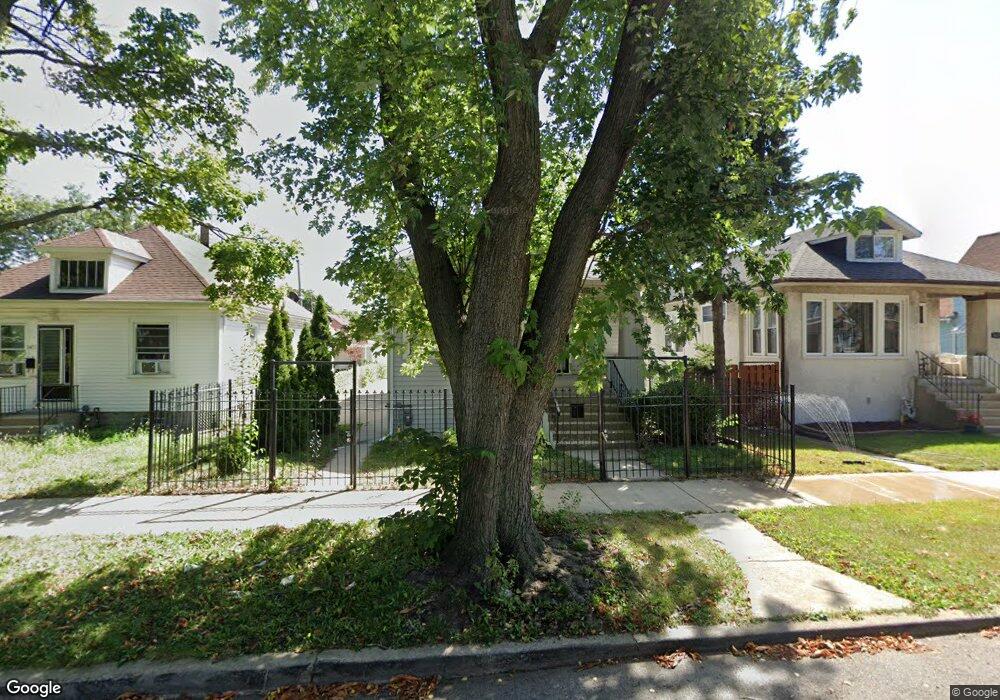
3407 W 64th Place Chicago, IL 60629
Marquette Park NeighborhoodEstimated Value: $221,000 - $309,000
4
Beds
2
Baths
1,031
Sq Ft
$245/Sq Ft
Est. Value
About This Home
This home is located at 3407 W 64th Place, Chicago, IL 60629 and is currently estimated at $252,629, approximately $245 per square foot. 3407 W 64th Place is a home located in Cook County with nearby schools including Eberhart Elementary School, Hubbard High School, and Catalyst Maria Charter School.
Ownership History
Date
Name
Owned For
Owner Type
Purchase Details
Closed on
Nov 6, 2017
Sold by
South Bay Partners Llc
Bought by
Hernandez Victor G
Current Estimated Value
Home Financials for this Owner
Home Financials are based on the most recent Mortgage that was taken out on this home.
Original Mortgage
$197,385
Outstanding Balance
$164,614
Interest Rate
3.94%
Mortgage Type
New Conventional
Estimated Equity
$88,015
Purchase Details
Closed on
Jul 18, 2017
Sold by
Pnc Bank Na
Bought by
South Bay Partners Llc
Purchase Details
Closed on
Jan 12, 2017
Sold by
Lopez Candelario
Bought by
Pnc Bank Na
Purchase Details
Closed on
Jun 9, 2003
Sold by
Bocanegra Jesus
Bought by
Lopez Candelario
Home Financials for this Owner
Home Financials are based on the most recent Mortgage that was taken out on this home.
Original Mortgage
$129,418
Interest Rate
5.3%
Mortgage Type
FHA
Purchase Details
Closed on
Apr 4, 2003
Sold by
Bank Of America Na
Bought by
Bocanegra Jesus
Create a Home Valuation Report for This Property
The Home Valuation Report is an in-depth analysis detailing your home's value as well as a comparison with similar homes in the area
Home Values in the Area
Average Home Value in this Area
Purchase History
| Date | Buyer | Sale Price | Title Company |
|---|---|---|---|
| Hernandez Victor G | $203,500 | Fidelity National Title | |
| South Bay Partners Llc | $82,500 | Fidelity National Title | |
| Pnc Bank Na | -- | None Available | |
| Lopez Candelario | $131,500 | Chicago Title Insurance Co | |
| Bocanegra Jesus | -- | Git |
Source: Public Records
Mortgage History
| Date | Status | Borrower | Loan Amount |
|---|---|---|---|
| Open | Hernandez Victor G | $197,385 | |
| Previous Owner | Lopez Candelario | $129,418 |
Source: Public Records
Tax History
| Year | Tax Paid | Tax Assessment Tax Assessment Total Assessment is a certain percentage of the fair market value that is determined by local assessors to be the total taxable value of land and additions on the property. | Land | Improvement |
|---|---|---|---|---|
| 2025 | $2,479 | $17,000 | $2,325 | $14,675 |
| 2024 | $2,479 | $17,000 | $2,325 | $14,675 |
| 2023 | $2,395 | $15,001 | $3,953 | $11,048 |
| 2022 | $2,395 | $15,001 | $3,953 | $11,048 |
| 2021 | $2,346 | $14,999 | $3,952 | $11,047 |
| 2020 | $2,107 | $12,500 | $3,952 | $8,548 |
| 2019 | $2,179 | $14,205 | $3,952 | $10,253 |
| 2018 | $2,824 | $14,205 | $3,952 | $10,253 |
| 2017 | $1,666 | $11,065 | $3,487 | $7,578 |
| 2016 | $1,727 | $11,065 | $3,487 | $7,578 |
| 2015 | $1,558 | $11,065 | $3,487 | $7,578 |
| 2014 | $1,577 | $11,002 | $3,255 | $7,747 |
| 2013 | $1,535 | $11,002 | $3,255 | $7,747 |
Source: Public Records
Map
Nearby Homes
- 3416 W 64th Place
- 3424 W 64th Place
- 3343 W 64th Place
- 3411 W 63rd Place
- 3604 W 65th Place
- 3220 W 66th St
- 3545 W 62nd Place
- 3651 W 64th Place
- 6339 S Troy St
- 6319 S Troy St
- 3501 W 61st Place
- 3313 W 61st Place
- 6409 S Albany Ave
- 3700 W 63rd St
- 3511 W 61st St
- 3750 W 65th St
- 6333 S Whipple St
- 3802 W 64th St
- 3822 W 64th St
- 3320 W 60th Place
- 3411 W 64th Place
- 3403 W 64th Place
- 3413 W 64th Place
- 3415 W 64th Place
- 3417 W 64th Place
- 3408 W 65th St
- 3404 W 65th St
- 3410 W 65th St
- 3423 W 64th Place
- 3400 W 65th St
- 3412 W 65th St
- 3357 W 64th Place
- 3416 W 65th St
- 3408 W 64th Place
- 3425 W 64th Place
- 3400 W 64th Place
- 3404 W 64th Place
- 3412 W 64th Place
- 3418 W 65th St Unit 1
- 3418 W 65th St
Your Personal Tour Guide
Ask me questions while you tour the home.