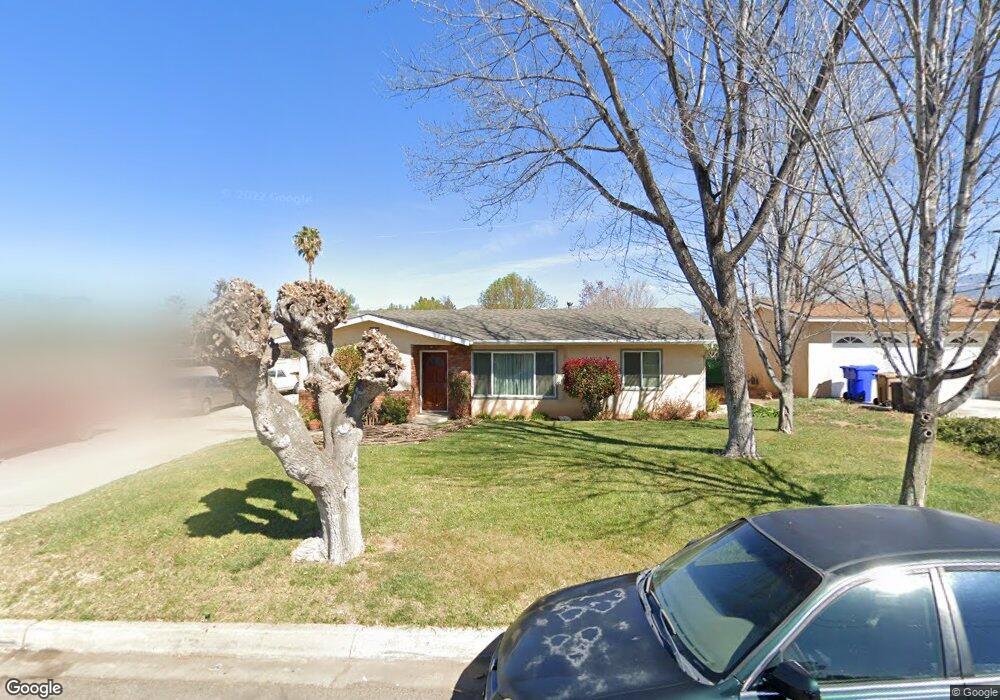
34070 Mariposa St Yucaipa, CA 92399
Estimated Value: $483,000 - $576,000
4
Beds
2
Baths
1,706
Sq Ft
$315/Sq Ft
Est. Value
About This Home
This home is located at 34070 Mariposa St, Yucaipa, CA 92399 and is currently estimated at $537,726, approximately $315 per square foot. 34070 Mariposa St is a home located in San Bernardino County with nearby schools including Valley Elementary School, Mesa View Middle School, and Yucaipa High School.
Ownership History
Date
Name
Owned For
Owner Type
Purchase Details
Closed on
Mar 24, 2009
Sold by
Us Bank National Association
Bought by
Resendez Eddie
Current Estimated Value
Home Financials for this Owner
Home Financials are based on the most recent Mortgage that was taken out on this home.
Original Mortgage
$166,822
Outstanding Balance
$104,206
Interest Rate
4.8%
Mortgage Type
FHA
Estimated Equity
$433,520
Purchase Details
Closed on
Dec 4, 2008
Sold by
Pavlinich Ronald P and Emerson Kimberly J
Bought by
Us Bank National Association
Purchase Details
Closed on
Oct 29, 2002
Sold by
Otto Robert J
Bought by
Pavlinich Ronald P and Emerson Kimberly J
Home Financials for this Owner
Home Financials are based on the most recent Mortgage that was taken out on this home.
Original Mortgage
$162,400
Interest Rate
6.99%
Create a Home Valuation Report for This Property
The Home Valuation Report is an in-depth analysis detailing your home's value as well as a comparison with similar homes in the area
Home Values in the Area
Average Home Value in this Area
Purchase History
| Date | Buyer | Sale Price | Title Company |
|---|---|---|---|
| Resendez Eddie | $169,900 | Ticor | |
| Us Bank National Association | $148,200 | Accommodation | |
| Pavlinich Ronald P | $203,000 | Nti |
Source: Public Records
Mortgage History
| Date | Status | Borrower | Loan Amount |
|---|---|---|---|
| Open | Resendez Eddie | $166,822 | |
| Previous Owner | Pavlinich Ronald P | $162,400 |
Source: Public Records
Tax History Compared to Growth
Tax History
| Year | Tax Paid | Tax Assessment Tax Assessment Total Assessment is a certain percentage of the fair market value that is determined by local assessors to be the total taxable value of land and additions on the property. | Land | Improvement |
|---|---|---|---|---|
| 2025 | $3,025 | $218,797 | $70,830 | $147,967 |
| 2024 | $3,025 | $214,507 | $69,441 | $145,066 |
| 2023 | $2,923 | $210,301 | $68,079 | $142,222 |
| 2022 | $2,770 | $206,177 | $66,744 | $139,433 |
| 2021 | $2,723 | $202,134 | $65,435 | $136,699 |
| 2020 | $2,735 | $200,061 | $64,764 | $135,297 |
| 2019 | $2,641 | $196,138 | $63,494 | $132,644 |
| 2018 | $2,352 | $192,292 | $62,249 | $130,043 |
| 2017 | $2,302 | $188,521 | $61,028 | $127,493 |
| 2016 | $2,271 | $184,824 | $59,831 | $124,993 |
| 2015 | $2,248 | $182,047 | $58,932 | $123,115 |
| 2014 | $2,203 | $178,481 | $57,778 | $120,703 |
Source: Public Records
Map
Nearby Homes
- 12448 6th St
- 36551 Avenue E
- 34184 Fairview Dr
- 34075 Lily Rd Unit 37
- 34083 Lily Rd Unit 33
- 12798 6th St
- 12278 5th St
- 12813 7th St Unit 26
- 12220 5th St Unit 193
- 12220 5th St Unit 146
- 34225 Via Buena Dr
- 12830 6th St Unit 43
- 12830 6th St Unit 2
- 12830 6th St Unit 15
- 12739 Valley View St
- 12510 8th St
- 12422 Stardell Ln
- 34417 Fairview Dr
- 12680 4th St Unit 32
- 12680 4th St
- 34060 Mariposa St
- 12540 6th St
- 12518 6th St
- 34069 Avenue E
- 34050 Mariposa St
- 34922 Mariposa St
- 12506 6th St
- 12558 6th St
- 12506 6th St
- 34079 Mariposa St
- 34051 Avenue E
- 34065 Mariposa St
- 12506 1/2 6th St
- 34040 Mariposa St
- 12566 6th St
- 12508 6th St
- 12531 6th St
- 34055 Mariposa St
- 34081 Avenue E
- 12525 6th St