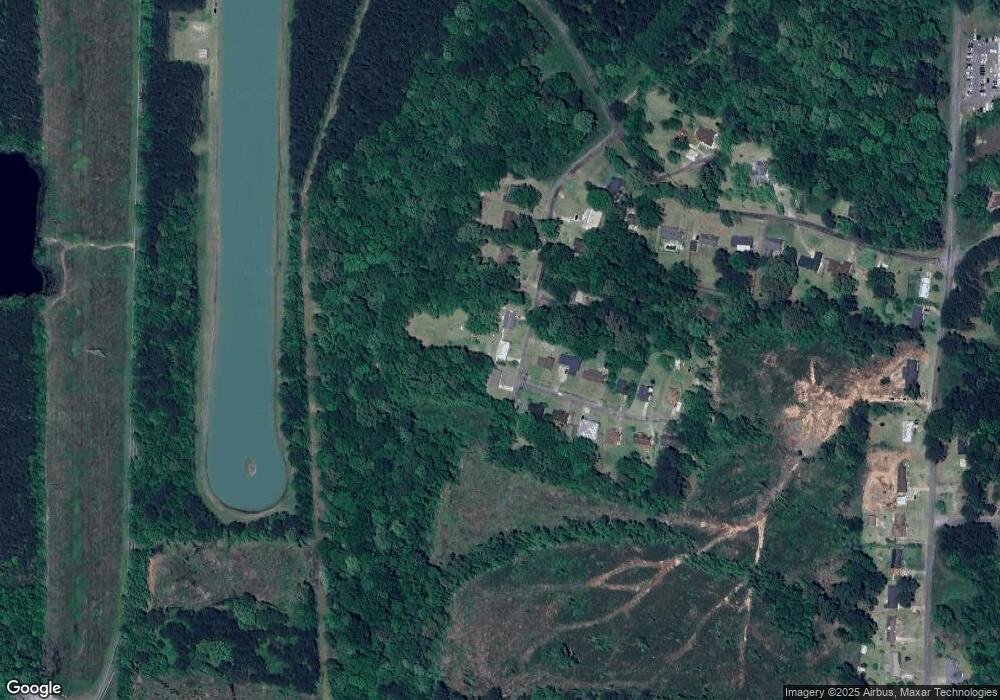
3409 69th Ave Meridian, MS 39307
Estimated Value: $92,000 - $139,000
--
Bed
--
Bath
1,320
Sq Ft
$91/Sq Ft
Est. Value
About This Home
This home is located at 3409 69th Ave, Meridian, MS 39307 and is currently estimated at $119,506, approximately $90 per square foot. 3409 69th Ave is a home located in Lauderdale County with nearby schools including T.J. Harris Elementary School, Northwest Middle School, and Meridian High School.
Ownership History
Date
Name
Owned For
Owner Type
Purchase Details
Closed on
Jan 25, 2022
Sold by
Youngblood Amy M
Bought by
Walker Shanice Quinta
Current Estimated Value
Home Financials for this Owner
Home Financials are based on the most recent Mortgage that was taken out on this home.
Original Mortgage
$98,560
Outstanding Balance
$91,750
Interest Rate
3.76%
Mortgage Type
New Conventional
Estimated Equity
$27,756
Purchase Details
Closed on
Nov 5, 2019
Sold by
Wheatley Donna
Bought by
Youngblood Amy M
Purchase Details
Closed on
Aug 31, 2016
Bought by
Bruce Joseph
Home Financials for this Owner
Home Financials are based on the most recent Mortgage that was taken out on this home.
Original Mortgage
$192,000
Interest Rate
3.43%
Create a Home Valuation Report for This Property
The Home Valuation Report is an in-depth analysis detailing your home's value as well as a comparison with similar homes in the area
Home Values in the Area
Average Home Value in this Area
Purchase History
| Date | Buyer | Sale Price | Title Company |
|---|---|---|---|
| Walker Shanice Quinta | $123,200 | Attorney Only | |
| Youngblood Amy M | -- | -- | |
| Bruce Joseph | -- | -- |
Source: Public Records
Mortgage History
| Date | Status | Borrower | Loan Amount |
|---|---|---|---|
| Open | Walker Shanice Quinta | $98,560 | |
| Previous Owner | Bruce Joseph | $192,000 | |
| Previous Owner | Bruce Joseph | -- | |
| Closed | Walker Shanice Quinta | $7,000 |
Source: Public Records
Tax History Compared to Growth
Tax History
| Year | Tax Paid | Tax Assessment Tax Assessment Total Assessment is a certain percentage of the fair market value that is determined by local assessors to be the total taxable value of land and additions on the property. | Land | Improvement |
|---|---|---|---|---|
| 2024 | $1,559 | $10,537 | $0 | $0 |
| 2023 | $1,589 | $8,941 | $0 | $0 |
| 2022 | $2,384 | $13,412 | $0 | $0 |
| 2021 | $2,313 | $13,239 | $0 | $0 |
| 2020 | $2,270 | $13,239 | $0 | $0 |
| 2019 | $2,203 | $12,848 | $0 | $0 |
| 2018 | $2,203 | $0 | $0 | $0 |
| 2017 | $2,203 | $85,650 | $15,000 | $70,650 |
| 2016 | $2,203 | $85,650 | $15,000 | $70,650 |
| 2015 | $2,182 | $84,840 | $20,000 | $64,840 |
| 2014 | $2,182 | $84,840 | $20,000 | $64,840 |
Source: Public Records
Map
Nearby Homes