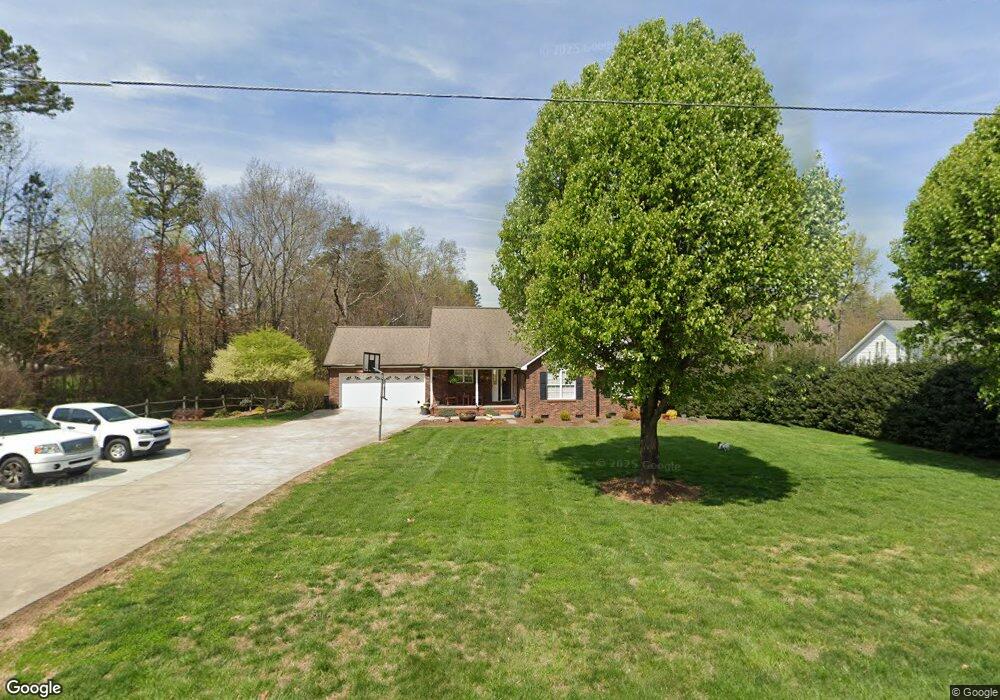
3409 Asbury Church Rd Lincolnton, NC 28092
Estimated Value: $283,000 - $400,000
5
Beds
3
Baths
1,805
Sq Ft
$203/Sq Ft
Est. Value
About This Home
This home is located at 3409 Asbury Church Rd, Lincolnton, NC 28092 and is currently estimated at $365,546, approximately $202 per square foot. 3409 Asbury Church Rd is a home located in Lincoln County with nearby schools including Iron Station Elementary School, North Lincoln Middle School, and North Lincoln High School.
Ownership History
Date
Name
Owned For
Owner Type
Purchase Details
Closed on
Feb 24, 2025
Sold by
Lewis Jonathan T and Lewis Kendra C
Bought by
Lewis Jonathan T
Current Estimated Value
Purchase Details
Closed on
Apr 19, 2017
Sold by
Conway Benita
Bought by
Lewis Jonathan T
Purchase Details
Closed on
Dec 7, 2015
Sold by
Conway Benita
Bought by
Curtis Tonya L and Lewis Jonathan T
Purchase Details
Closed on
Oct 27, 2015
Sold by
Lloyd John D and Lloyd Tabatha
Bought by
Conway Benita
Purchase Details
Closed on
Dec 1, 2003
Bought by
Lloyd John D and Lloyd Tabatha
Purchase Details
Closed on
Jun 27, 2003
Bought by
Wachovia Bank Na
Purchase Details
Closed on
Jan 28, 1998
Bought by
Bullard Jeffrey M and Lee Anne
Purchase Details
Closed on
Sep 12, 1996
Bought by
Garrett Eugene Talmage and Garrett Sarah W
Create a Home Valuation Report for This Property
The Home Valuation Report is an in-depth analysis detailing your home's value as well as a comparison with similar homes in the area
Home Values in the Area
Average Home Value in this Area
Purchase History
| Date | Buyer | Sale Price | Title Company |
|---|---|---|---|
| Lewis Jonathan T | -- | None Listed On Document | |
| Lewis Jonathan T | -- | None Available | |
| Conway Benita | -- | None Available | |
| Lewis Jonathan T | -- | None Available | |
| Curtis Tonya L | -- | None Available | |
| Conway Benita | $127,000 | None Available | |
| Lloyd John D | $157,500 | -- | |
| Wachovia Bank Na | $144,200 | -- | |
| Bullard Jeffrey M | $159,000 | -- | |
| Garrett Eugene Talmage | $162,500 | -- |
Source: Public Records
Tax History Compared to Growth
Tax History
| Year | Tax Paid | Tax Assessment Tax Assessment Total Assessment is a certain percentage of the fair market value that is determined by local assessors to be the total taxable value of land and additions on the property. | Land | Improvement |
|---|---|---|---|---|
| 2025 | $2,162 | $324,050 | $43,000 | $281,050 |
| 2024 | $2,142 | $324,050 | $43,000 | $281,050 |
| 2023 | $2,137 | $324,050 | $43,000 | $281,050 |
| 2022 | $1,781 | $223,963 | $34,000 | $189,963 |
| 2021 | $1,781 | $223,963 | $34,000 | $189,963 |
| 2020 | $1,621 | $223,963 | $34,000 | $189,963 |
| 2019 | $1,577 | $223,963 | $34,000 | $189,963 |
| 2018 | $1,467 | $190,840 | $32,000 | $158,840 |
| 2017 | $1,357 | $190,840 | $32,000 | $158,840 |
| 2016 | $1,357 | $190,840 | $32,000 | $158,840 |
| 2015 | $1,416 | $190,840 | $32,000 | $158,840 |
| 2014 | $1,449 | $197,848 | $32,000 | $165,848 |
Source: Public Records
Map
Nearby Homes
- 370 Sherrill Farm Rd
- 2583 Wallace Acres Ln
- 2914 Weatherfield Dr
- 2983 Tavistock Ln
- 2911 Weatherfield Dr
- 2984 N Carolina 27
- lot 22 Weatherwood Dr Unit 22
- 3164 Andrew Link Rd
- 2794 N Carolina Highway 150
- 2546 N Carolina Highway 150
- 000 Curveview Rd
- 3478 N Carolina Highway 150
- 1404 Old Mill Rd
- 1471 Arden Dr
- 575 Hill Rd
- 1894 N Carolina 73
- 1335 Huckleberry Dr
- 741 Sunridge Dr
- 00 Mcalister Rd
- 2202 Carpenter Farms Dr
- 3419 Asbury Church Rd
- 186 Lariat Dr
- 174 Lariat Dr
- 3427 Asbury Church Rd
- 196 Lariat Dr
- 3416 Asbury Church Rd
- 210 Lariat Dr
- 3441 Asbury Church Rd
- 3361 Asbury Church Rd
- 3440 Asbury Church Rd
- 195 Lariat Dr
- 3405 Asbury Church Rd
- 213 Lariat Dr
- 226 Lariat Dr
- 3347 Asbury Church Rd
- 3356 Asbury Church Rd
- 3467 Asbury Church Rd
- 3193 Fair Oaks Dr
- 3193 Fair Oaks Dr Unit 9
- 3184 Fair Oaks Dr