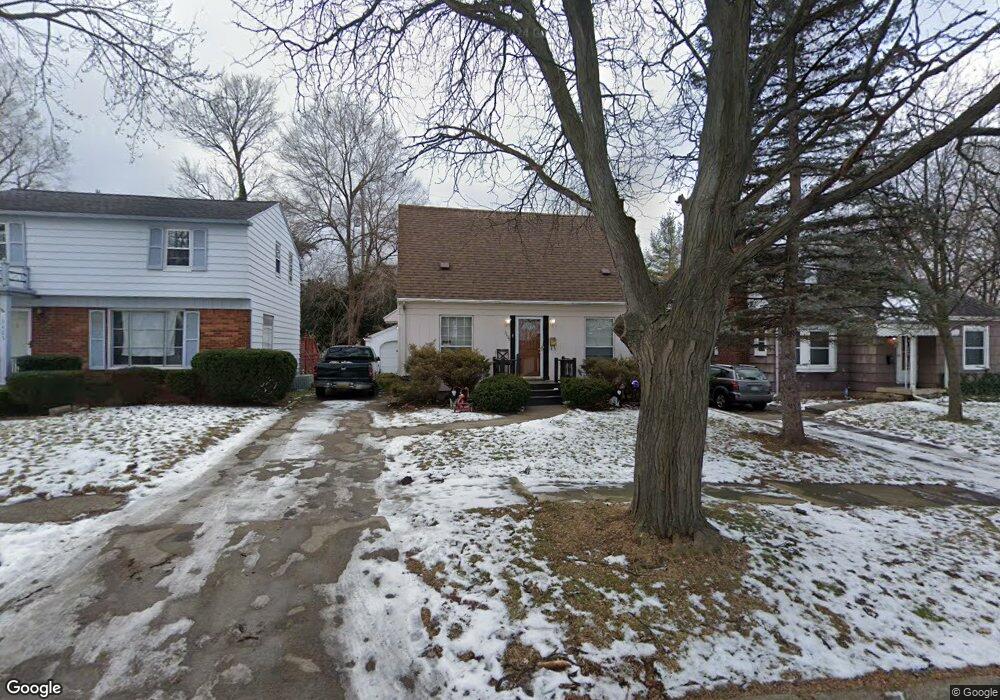
3409 Sherwood Dr Flint, MI 48503
Glendale NeighborhoodEstimated Value: $80,000 - $96,000
3
Beds
2
Baths
1,216
Sq Ft
$70/Sq Ft
Est. Value
About This Home
This home is located at 3409 Sherwood Dr, Flint, MI 48503 and is currently estimated at $85,375, approximately $70 per square foot. 3409 Sherwood Dr is a home located in Genesee County with nearby schools including Durant-Tuuri-Mott Elementary School, St. Paul Lutheran School, and St John Vianney Catholic School.
Ownership History
Date
Name
Owned For
Owner Type
Purchase Details
Closed on
Nov 4, 2009
Sold by
Donovan Shaun and Secretary Of Housing & Urban D
Bought by
Horne Jonathon and Horne Patricia
Current Estimated Value
Purchase Details
Closed on
Jan 11, 2008
Sold by
Mortgage Electronic Registration Systems
Bought by
Hud
Purchase Details
Closed on
Dec 7, 2007
Sold by
Choate Randi L
Bought by
Mortgage Electronic Registration Systems
Purchase Details
Closed on
Feb 1, 2006
Sold by
Ocallaghan Timothy
Bought by
Ocallaghan Randi Lynn
Purchase Details
Closed on
Dec 17, 2002
Sold by
Lipp Paul and Packer Joshua W
Bought by
Choate Randi L
Purchase Details
Closed on
Aug 31, 1999
Sold by
Gaus D Gaus E and Gaus Adeline
Bought by
Packer Joshua W and Packer Sari A
Home Financials for this Owner
Home Financials are based on the most recent Mortgage that was taken out on this home.
Original Mortgage
$74,100
Interest Rate
7.77%
Mortgage Type
Purchase Money Mortgage
Create a Home Valuation Report for This Property
The Home Valuation Report is an in-depth analysis detailing your home's value as well as a comparison with similar homes in the area
Home Values in the Area
Average Home Value in this Area
Purchase History
| Date | Buyer | Sale Price | Title Company |
|---|---|---|---|
| Horne Jonathon | $12,000 | None Available | |
| Hud | -- | None Available | |
| Mortgage Electronic Registration Systems | $97,769 | None Available | |
| Ocallaghan Randi Lynn | -- | None Available | |
| Choate Randi L | $100,000 | Metropolitan Title Company | |
| Packer Joshua W | $78,000 | Metropolitan Title Company |
Source: Public Records
Mortgage History
| Date | Status | Borrower | Loan Amount |
|---|---|---|---|
| Previous Owner | Packer Joshua W | $74,100 |
Source: Public Records
Tax History Compared to Growth
Tax History
| Year | Tax Paid | Tax Assessment Tax Assessment Total Assessment is a certain percentage of the fair market value that is determined by local assessors to be the total taxable value of land and additions on the property. | Land | Improvement |
|---|---|---|---|---|
| 2025 | $1,458 | $37,600 | $0 | $0 |
| 2024 | $1,040 | $32,400 | $0 | $0 |
| 2023 | $1,018 | $29,400 | $0 | $0 |
| 2022 | $0 | $23,100 | $0 | $0 |
| 2021 | $1,062 | $23,600 | $0 | $0 |
| 2020 | $952 | $21,200 | $0 | $0 |
| 2019 | $1,815 | $16,100 | $0 | $0 |
| 2018 | $937 | $17,500 | $0 | $0 |
| 2017 | $1,207 | $0 | $0 | $0 |
| 2016 | $903 | $0 | $0 | $0 |
| 2015 | -- | $0 | $0 | $0 |
| 2014 | -- | $0 | $0 | $0 |
| 2012 | -- | $17,400 | $0 | $0 |
Source: Public Records
Map
Nearby Homes
- 3617 Sherwood Dr
- 3517 Norwood Dr
- 3119 Sherwood Dr
- 3414 Van Buren Ave
- 3705 Gratiot Ave
- 612 Bradley Ave
- 911 Hughes Ave
- 916 Mann Ave
- 2663 W Court St
- 932 Bradley Ave
- 2332 Nolen Dr
- 849 Frank St
- 2448 Thomas St
- 960 Mann Ave
- 2553 Thomas St
- 448 Dougherty Place
- 2539 Norbert St
- 976 Barney Ave
- 3821 W Court St
- 3921 Joyner St
- 3405 Sherwood Dr
- 3413 Sherwood Dr
- 3401 Sherwood Dr
- 3422 Brentwood Dr
- 3418 Brentwood Dr
- 3501 Sherwood Dr
- 3502 Brentwood Dr
- 3325 Sherwood Dr
- 419 Allendale Place Unit Bldg-Unit
- 419 Allendale Place
- 3410 Sherwood Dr
- 3506 Brentwood Dr
- 3404 Sherwood Dr
- 3512 Brentwood Dr
- 3321 Sherwood Dr
- 3322 Sherwood Dr
- 415 Allendale Place
- 3402 Brentwood Dr
- 3410 Brentwood Dr
- 3421 Brentwood Dr