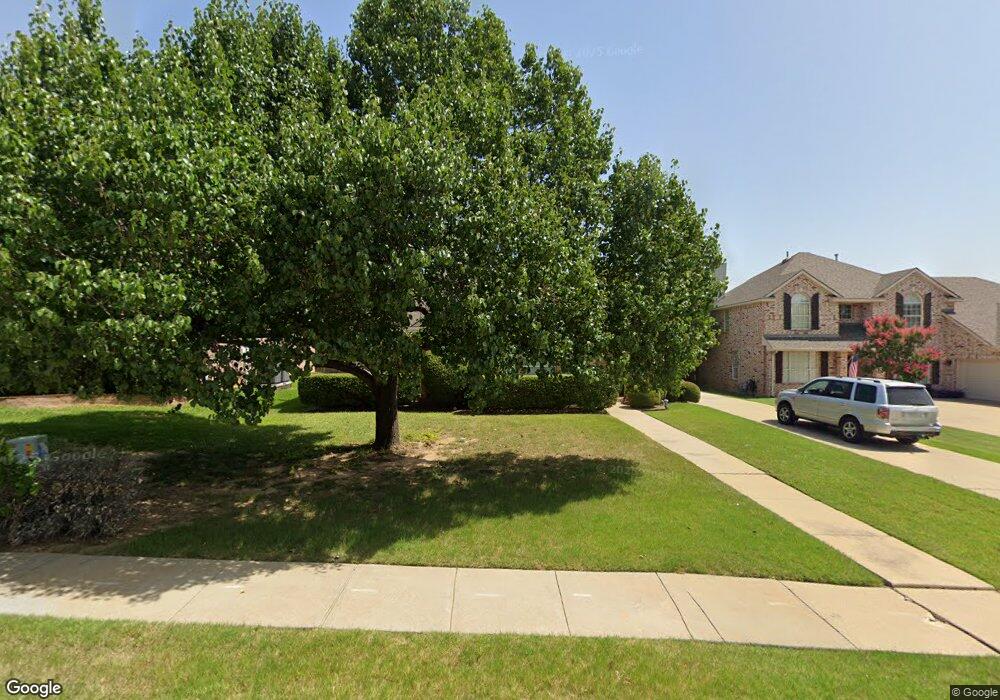
3409 Sundown Blvd Denton, TX 76210
South Denton NeighborhoodEstimated Value: $422,506 - $448,000
4
Beds
3
Baths
2,419
Sq Ft
$182/Sq Ft
Est. Value
About This Home
This home is located at 3409 Sundown Blvd, Denton, TX 76210 and is currently estimated at $439,377, approximately $181 per square foot. 3409 Sundown Blvd is a home located in Denton County with nearby schools including Houston Elementary School, McMath Middle School, and Denton High School.
Ownership History
Date
Name
Owned For
Owner Type
Purchase Details
Closed on
Feb 25, 2008
Sold by
Redmond Matthew
Bought by
Redmond Windee D
Current Estimated Value
Home Financials for this Owner
Home Financials are based on the most recent Mortgage that was taken out on this home.
Original Mortgage
$154,700
Interest Rate
5.47%
Mortgage Type
Stand Alone Refi Refinance Of Original Loan
Purchase Details
Closed on
Aug 16, 2002
Sold by
Burdick James R and Burdick Davina M
Bought by
Redmond Matthew
Home Financials for this Owner
Home Financials are based on the most recent Mortgage that was taken out on this home.
Original Mortgage
$159,497
Interest Rate
6.26%
Mortgage Type
FHA
Purchase Details
Closed on
May 22, 2000
Sold by
Rh Of Texas Ltd Partnership
Bought by
Burdick James R and Burdick Davina M
Home Financials for this Owner
Home Financials are based on the most recent Mortgage that was taken out on this home.
Original Mortgage
$161,050
Interest Rate
8.13%
Create a Home Valuation Report for This Property
The Home Valuation Report is an in-depth analysis detailing your home's value as well as a comparison with similar homes in the area
Home Values in the Area
Average Home Value in this Area
Purchase History
| Date | Buyer | Sale Price | Title Company |
|---|---|---|---|
| Redmond Windee D | -- | First American Title Ins Co | |
| Redmond Matthew | -- | -- | |
| Burdick James R | -- | -- |
Source: Public Records
Mortgage History
| Date | Status | Borrower | Loan Amount |
|---|---|---|---|
| Closed | Redmond Windee D | $154,700 | |
| Previous Owner | Redmond Matthew | $159,497 | |
| Previous Owner | Burdick James R | $161,050 |
Source: Public Records
Tax History
| Year | Tax Paid | Tax Assessment Tax Assessment Total Assessment is a certain percentage of the fair market value that is determined by local assessors to be the total taxable value of land and additions on the property. | Land | Improvement |
|---|---|---|---|---|
| 2025 | $6,810 | $448,272 | $94,770 | $353,502 |
| 2024 | $8,006 | $414,775 | $0 | $0 |
| 2023 | $6,003 | $377,068 | $94,770 | $315,288 |
| 2022 | $7,277 | $342,789 | $94,770 | $316,031 |
| 2021 | $6,928 | $314,227 | $70,216 | $244,011 |
| 2020 | $6,475 | $283,296 | $70,216 | $213,080 |
| 2019 | $6,635 | $278,073 | $70,216 | $207,857 |
| 2018 | $6,411 | $265,410 | $70,216 | $195,194 |
| 2017 | $6,003 | $242,864 | $41,493 | $201,371 |
| 2016 | $5,528 | $223,656 | $41,493 | $186,911 |
| 2015 | $4,590 | $203,324 | $41,493 | $161,831 |
| 2014 | $4,590 | $194,076 | $41,493 | $152,998 |
| 2013 | -- | $176,433 | $41,493 | $134,940 |
Source: Public Records
Map
Nearby Homes
- 2209 Loon Lake Rd
- 2009 Lake Fork Ct
- 2312 Caddo Cir
- 2409 Loon Lake Rd
- 2508 Pioneer Dr
- 3509 Mustang Dr
- 2600 Pioneer Dr
- 900 Ellison Park Cir
- 2508 Kariba Ln
- 2409 Tahoe Ln
- 1108 Ellison Park Cir
- 3321 Monte Carlo Ln
- 3100 Masthead Dr
- 2700 Crater Lake Ln
- 2721 Clubhouse Dr
- 2617 Hollow Ridge Dr
- 3717 Ranchman Blvd
- 2721 Arabian Ave
- 4105 Ranchman Blvd
- 1212 Pennsylvania Dr
- 3413 Sundown Blvd
- 3405 Sundown Blvd
- 3312 Mustang Dr
- 3417 Sundown Blvd
- 3308 Mustang Dr
- 3304 Mustang Dr
- 3316 Mustang Dr
- 3408 Sundown Blvd
- 3412 Sundown Blvd
- 3320 Mustang Dr
- 3421 Sundown Blvd
- 3300 Mustang Dr
- 3404 Sundown Blvd
- 3416 Sundown Blvd
- 3324 Mustang Dr
- 3425 Sundown Blvd
- 3328 Mustang Dr
- 2109 Spur Ct
- 3313 Mustang Dr
- 3317 Mustang Dr
Your Personal Tour Guide
Ask me questions while you tour the home.