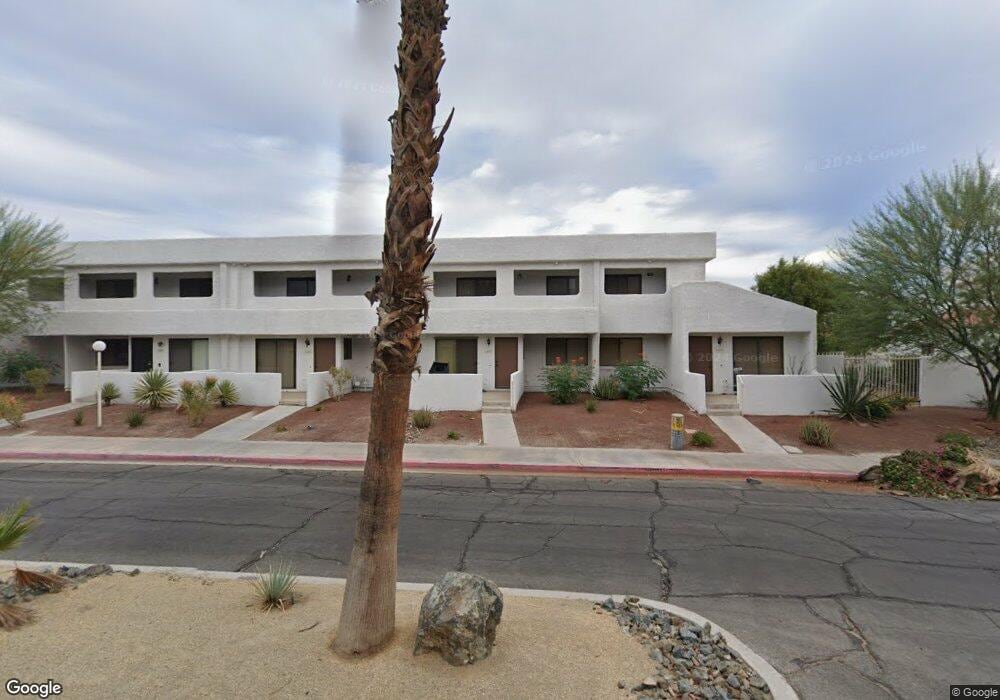
34097 Emily Way Rancho Mirage, CA 92270
Country Club NeighborhoodEstimated Value: $255,000 - $361,000
3
Beds
2
Baths
1,218
Sq Ft
$250/Sq Ft
Est. Value
About This Home
This home is located at 34097 Emily Way, Rancho Mirage, CA 92270 and is currently estimated at $304,356, approximately $249 per square foot. 34097 Emily Way is a home located in Riverside County with nearby schools including Cathedral City Elementary School, Nellie N. Coffman Middle School, and Cathedral City High School.
Ownership History
Date
Name
Owned For
Owner Type
Purchase Details
Closed on
Nov 17, 2023
Sold by
Hensel Cierra
Bought by
Cierra Hensel Trust and Hensel
Current Estimated Value
Purchase Details
Closed on
Dec 24, 2020
Sold by
Lacombe Richard E and Lacombe Mary V
Bought by
Hensel Cierra
Home Financials for this Owner
Home Financials are based on the most recent Mortgage that was taken out on this home.
Original Mortgage
$140,250
Interest Rate
2.71%
Mortgage Type
New Conventional
Purchase Details
Closed on
Jun 14, 2016
Sold by
Lacombe Richard E and Lacombe Mary V
Bought by
Lacombe Richard E and Lacombe Mary
Purchase Details
Closed on
Jul 30, 1998
Sold by
Chambers Ann
Bought by
Lacombe Richard and Lacombe Mary
Purchase Details
Closed on
Mar 25, 1998
Sold by
Loresch Mary Ellen
Bought by
Lacombe Richard and Lacombe Mary
Create a Home Valuation Report for This Property
The Home Valuation Report is an in-depth analysis detailing your home's value as well as a comparison with similar homes in the area
Home Values in the Area
Average Home Value in this Area
Purchase History
| Date | Buyer | Sale Price | Title Company |
|---|---|---|---|
| Cierra Hensel Trust | -- | None Listed On Document | |
| Hensel Cierra | $165,000 | Lawyers Title Company | |
| Lacombe Richard E | -- | None Available | |
| Lacombe Richard | -- | -- | |
| Lacombe Richard | $69,000 | Benefit Land Title Ins Co |
Source: Public Records
Mortgage History
| Date | Status | Borrower | Loan Amount |
|---|---|---|---|
| Previous Owner | Hensel Cierra | $140,250 |
Source: Public Records
Tax History Compared to Growth
Tax History
| Year | Tax Paid | Tax Assessment Tax Assessment Total Assessment is a certain percentage of the fair market value that is determined by local assessors to be the total taxable value of land and additions on the property. | Land | Improvement |
|---|---|---|---|---|
| 2025 | $2,637 | $178,599 | $54,121 | $124,478 |
| 2024 | $2,637 | $175,098 | $53,060 | $122,038 |
| 2023 | $2,627 | $171,666 | $52,020 | $119,646 |
| 2022 | $2,565 | $168,300 | $51,000 | $117,300 |
| 2021 | $1,764 | $101,815 | $25,445 | $76,370 |
| 2020 | $1,693 | $100,772 | $25,185 | $75,587 |
| 2019 | $1,669 | $98,797 | $24,692 | $74,105 |
| 2018 | $1,644 | $96,860 | $24,208 | $72,652 |
| 2017 | $1,624 | $94,962 | $23,734 | $71,228 |
| 2016 | $1,582 | $93,101 | $23,269 | $69,832 |
| 2015 | $1,537 | $91,704 | $22,920 | $68,784 |
| 2014 | $1,528 | $89,910 | $22,472 | $67,438 |
Source: Public Records
Map
Nearby Homes
- 34071 Denise Way
- 34354 Laura Way
- 64 Via Santo Tomas
- 59 Via Santo Tomas
- 105 Shoreline Dr
- 127 Via Santo Tomas
- 8 Via Santa Ramona
- 7 Lake Como Ct
- 34480 Vaquero Rd
- 609 Desert West Dr
- 350 Loch Lomond Rd
- 69771 Camino Pacifico
- 604 Desert West Dr
- 69727 Camino Pacifico
- 5 Lake Louise Ct
- 37 Shoreline Dr
- 35070 Maria Rd
- 35001 Vista Del Ladero
- 65 Shoreline Dr
- 40 Shoreline Dr
- 34105 Emily Way
- 34089 Emily Way
- 34081 Emily Way
- 34073 Emily Way
- 34113 Emily Way
- 34121 Emily Way
- 34119 Anita Way
- 34099 Anita Way
- 34129 Anita Way
- 34065 Emily Way
- 34109 Anita Way
- 34129 Emily Way
- 34137 Emily Way
- 34139 Anita Way
- 34057 Emily Way
- 34049 Emily Way
- 34149 Anita Way
- 34145 Emily Way
- 34041 Emily Way
- 34159 Anita Way