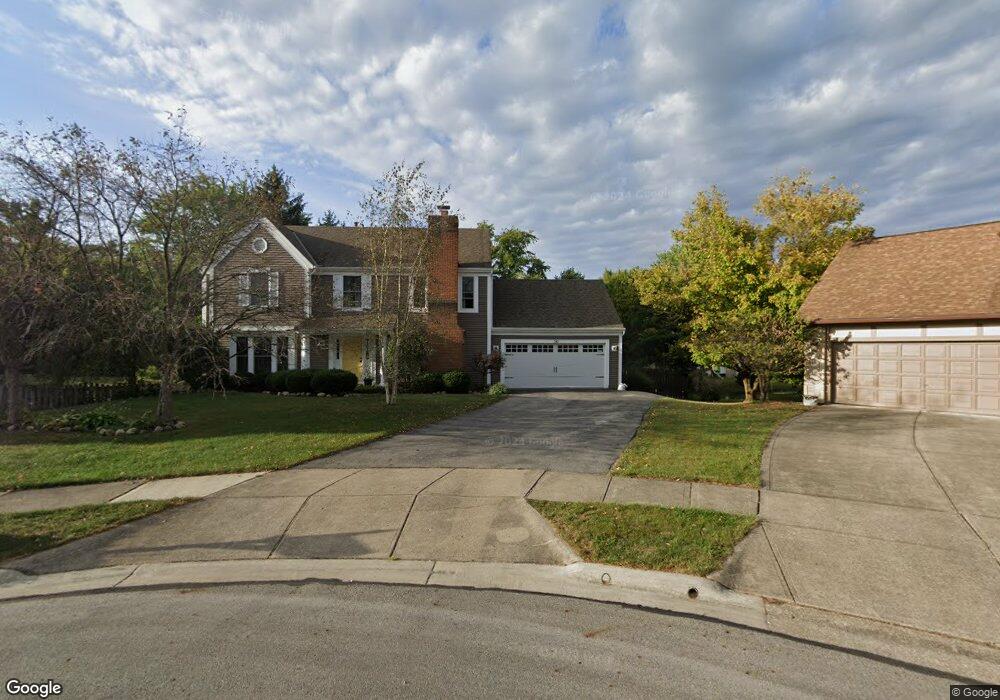
341 Cornhill Ct Westerville, OH 43081
Estimated Value: $499,000 - $546,000
4
Beds
3
Baths
2,372
Sq Ft
$221/Sq Ft
Est. Value
About This Home
This home is located at 341 Cornhill Ct, Westerville, OH 43081 and is currently estimated at $523,407, approximately $220 per square foot. 341 Cornhill Ct is a home located in Franklin County with nearby schools including Mcvay Elementary School, Walnut Springs Middle School, and Westerville-North High School.
Ownership History
Date
Name
Owned For
Owner Type
Purchase Details
Closed on
Jun 19, 2007
Sold by
Selby David E and Selby Debbie J
Bought by
Vandop Stephen and Vandop Van Dop
Current Estimated Value
Home Financials for this Owner
Home Financials are based on the most recent Mortgage that was taken out on this home.
Original Mortgage
$165,000
Outstanding Balance
$102,214
Interest Rate
6.42%
Mortgage Type
Purchase Money Mortgage
Estimated Equity
$421,193
Purchase Details
Closed on
Aug 21, 2002
Sold by
Vining Michael J and Vining Renee P
Bought by
Selby David E and Selby Debbie J
Home Financials for this Owner
Home Financials are based on the most recent Mortgage that was taken out on this home.
Original Mortgage
$254,847
Outstanding Balance
$106,758
Interest Rate
6.41%
Mortgage Type
VA
Estimated Equity
$416,649
Purchase Details
Closed on
Jun 4, 1991
Bought by
Vining Michael J
Purchase Details
Closed on
Jun 13, 1990
Purchase Details
Closed on
Sep 1, 1986
Create a Home Valuation Report for This Property
The Home Valuation Report is an in-depth analysis detailing your home's value as well as a comparison with similar homes in the area
Home Values in the Area
Average Home Value in this Area
Purchase History
| Date | Buyer | Sale Price | Title Company |
|---|---|---|---|
| Vandop Stephen | $280,000 | Talon Group | |
| Selby David E | $249,900 | Esquire Title | |
| Vining Michael J | $177,900 | -- | |
| -- | $167,500 | -- | |
| -- | $144,400 | -- |
Source: Public Records
Mortgage History
| Date | Status | Borrower | Loan Amount |
|---|---|---|---|
| Open | Vandop Stephen | $165,000 | |
| Open | Selby David E | $254,847 |
Source: Public Records
Tax History Compared to Growth
Tax History
| Year | Tax Paid | Tax Assessment Tax Assessment Total Assessment is a certain percentage of the fair market value that is determined by local assessors to be the total taxable value of land and additions on the property. | Land | Improvement |
|---|---|---|---|---|
| 2024 | $8,659 | $152,360 | $34,930 | $117,430 |
| 2023 | $8,475 | $152,355 | $34,930 | $117,425 |
| 2022 | $7,645 | $104,930 | $21,000 | $83,930 |
| 2021 | $7,709 | $104,930 | $21,000 | $83,930 |
| 2020 | $7,687 | $104,930 | $21,000 | $83,930 |
| 2019 | $6,719 | $86,590 | $17,500 | $69,090 |
| 2018 | $6,857 | $86,590 | $17,500 | $69,090 |
| 2017 | $6,939 | $86,590 | $17,500 | $69,090 |
| 2016 | $7,269 | $86,700 | $18,520 | $68,180 |
| 2015 | $7,128 | $86,700 | $18,520 | $68,180 |
| 2014 | $7,045 | $86,700 | $18,520 | $68,180 |
| 2013 | $3,158 | $76,755 | $17,640 | $59,115 |
Source: Public Records
Map
Nearby Homes
- 969 Farrington Dr
- 613 Valley Wood Ct
- 858 Knebworth Ct
- 1003 Autumn Meadows Dr
- 857 E Walnut St
- 1368 Nutmeg Ct
- 539 Cherrington Rd
- 1015 Autumn Woods Dr
- 994 Autumn Lake Ct
- 283 Apache Cir
- 1203 Autumn Creek Cir
- 192 Buckeye Ct
- 615 Vancouver Dr
- 187 Bernadine Ct
- 768 Collingwood Dr
- 430 Electric Ave
- 437 Potawatomi Dr
- 393 Sentry Ln
- 974 Timberbank Dr
- 203 Fairdale Ave
- 337 Cornhill Ct
- 345 Cornhill Ct
- 446 Mainsail Dr
- 438 Mainsail Dr
- 454 Mainsail Dr
- 969 Charterhouse Ct
- 333 Cornhill Ct
- 430 Mainsail Dr
- 351 Cornhill Ct
- 462 Mainsail Dr
- 330 Cornhill Ct
- 325 Cornhill Ct
- 424 Mainsail Dr
- 964 Charterhouse Ct
- 357 Cornhill Ct
- 346 Cornhill Ct
- 451 Mainsail Dr
- 443 Mainsail Dr
- 459 Mainsail Dr
- 435 Mainsail Dr