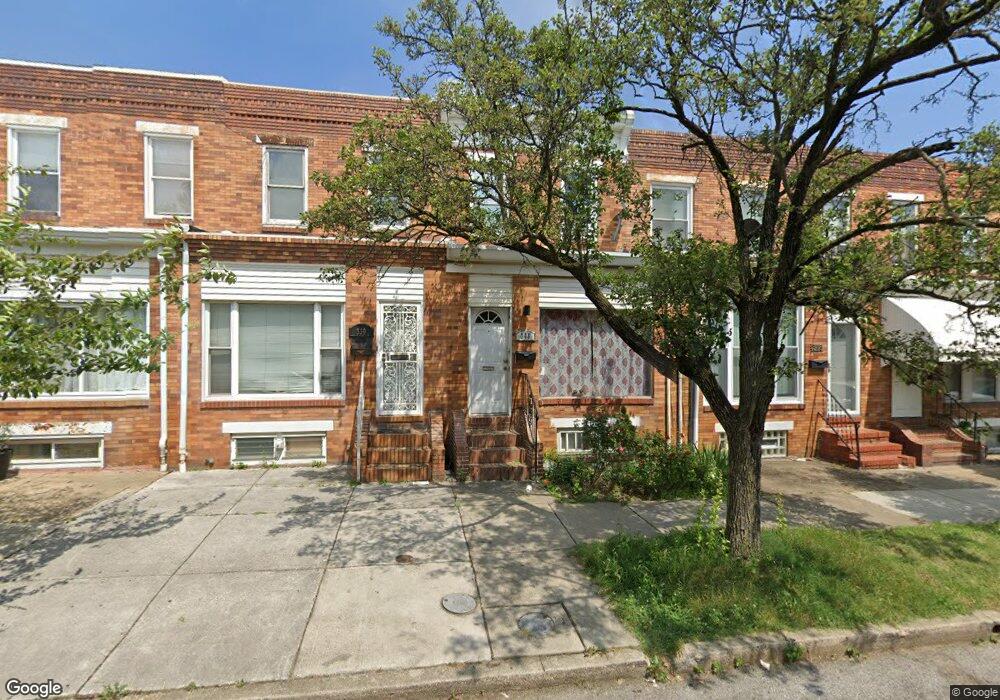
341 Cornwall St Baltimore, MD 21224
Bayview NeighborhoodEstimated Value: $175,321 - $181,000
3
Beds
2
Baths
1,380
Sq Ft
$129/Sq Ft
Est. Value
About This Home
This home is located at 341 Cornwall St, Baltimore, MD 21224 and is currently estimated at $178,161, approximately $129 per square foot. 341 Cornwall St is a home located in Baltimore City with nearby schools including John Ruhrah Elementary School, Booker T. Washington Middle School, and Patterson High School.
Ownership History
Date
Name
Owned For
Owner Type
Purchase Details
Closed on
Dec 21, 2011
Sold by
Fannie Mae
Bought by
Wang Young Y and Tian Jingyan
Current Estimated Value
Purchase Details
Closed on
Apr 11, 2011
Sold by
Crilley Norma M
Bought by
The Federal National Mortgage Associatio
Purchase Details
Closed on
Jan 22, 2007
Sold by
Crilley Norma M
Bought by
Federal National Mortgage Association and Association
Home Financials for this Owner
Home Financials are based on the most recent Mortgage that was taken out on this home.
Original Mortgage
$270,000
Interest Rate
6.53%
Mortgage Type
Reverse Mortgage Home Equity Conversion Mortgage
Create a Home Valuation Report for This Property
The Home Valuation Report is an in-depth analysis detailing your home's value as well as a comparison with similar homes in the area
Home Values in the Area
Average Home Value in this Area
Purchase History
| Date | Buyer | Sale Price | Title Company |
|---|---|---|---|
| Wang Young Y | $66,500 | American Trust Title Llc | |
| The Federal National Mortgage Associatio | $100,000 | None Available | |
| Federal National Mortgage Association | -- | -- | |
| Crilley Norma M | -- | -- |
Source: Public Records
Mortgage History
| Date | Status | Borrower | Loan Amount |
|---|---|---|---|
| Previous Owner | Crilley Norma M | $270,000 |
Source: Public Records
Tax History
| Year | Tax Paid | Tax Assessment Tax Assessment Total Assessment is a certain percentage of the fair market value that is determined by local assessors to be the total taxable value of land and additions on the property. | Land | Improvement |
|---|---|---|---|---|
| 2025 | $2,764 | $128,200 | $25,000 | $103,200 |
| 2024 | $2,764 | $117,667 | -- | -- |
| 2023 | $2,516 | $107,133 | $0 | $0 |
| 2022 | $2,280 | $96,600 | $25,000 | $71,600 |
| 2021 | $2,280 | $96,600 | $25,000 | $71,600 |
| 2020 | $2,077 | $96,600 | $25,000 | $71,600 |
| 2019 | $2,143 | $100,300 | $25,000 | $75,300 |
| 2018 | $2,162 | $99,600 | $0 | $0 |
| 2017 | $2,170 | $98,900 | $0 | $0 |
| 2016 | $3,011 | $98,200 | $0 | $0 |
| 2015 | $3,011 | $87,633 | $0 | $0 |
| 2014 | $3,011 | $77,067 | $0 | $0 |
Source: Public Records
Map
Nearby Homes
Your Personal Tour Guide
Ask me questions while you tour the home.