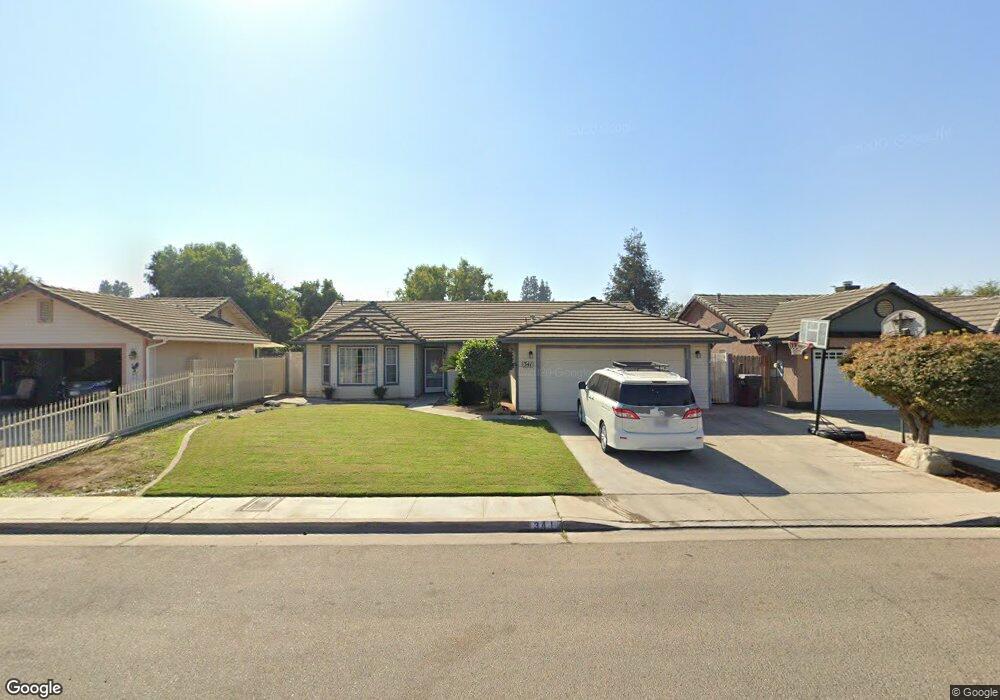
341 E Ponderosa Ave Reedley, CA 93654
Estimated Value: $352,859 - $457,000
3
Beds
2
Baths
1,516
Sq Ft
$265/Sq Ft
Est. Value
About This Home
This home is located at 341 E Ponderosa Ave, Reedley, CA 93654 and is currently estimated at $402,215, approximately $265 per square foot. 341 E Ponderosa Ave is a home located in Fresno County with nearby schools including Thomas Law Reed Elementary School, Reedley High School, and Reedley Middle College High.
Ownership History
Date
Name
Owned For
Owner Type
Purchase Details
Closed on
Jan 8, 2019
Sold by
Sanchez Carlos A Cruz and Cruz Yareli Munoz De
Bought by
Sanchez Carlos A Cruz and Cruz Yareli Munoz De
Current Estimated Value
Home Financials for this Owner
Home Financials are based on the most recent Mortgage that was taken out on this home.
Original Mortgage
$188,000
Outstanding Balance
$165,955
Interest Rate
4.8%
Mortgage Type
New Conventional
Estimated Equity
$236,260
Purchase Details
Closed on
Oct 24, 2011
Sold by
Prado Irene R
Bought by
Cruz Carlos A and Cruz Yareli Munoz
Home Financials for this Owner
Home Financials are based on the most recent Mortgage that was taken out on this home.
Original Mortgage
$153,061
Interest Rate
4.09%
Mortgage Type
New Conventional
Purchase Details
Closed on
Apr 2, 1996
Sold by
Rucobo Vincent and Rucobo Gloria
Bought by
Rucobo Vincent and Rucobo Gloria G
Create a Home Valuation Report for This Property
The Home Valuation Report is an in-depth analysis detailing your home's value as well as a comparison with similar homes in the area
Home Values in the Area
Average Home Value in this Area
Purchase History
| Date | Buyer | Sale Price | Title Company |
|---|---|---|---|
| Sanchez Carlos A Cruz | -- | Placer Title Company | |
| Cruz Carlos A | $150,000 | Chicago Title Company | |
| Rucobo Vincent | -- | -- |
Source: Public Records
Mortgage History
| Date | Status | Borrower | Loan Amount |
|---|---|---|---|
| Open | Sanchez Carlos A Cruz | $188,000 | |
| Closed | Cruz Carlos A | $153,061 |
Source: Public Records
Tax History Compared to Growth
Tax History
| Year | Tax Paid | Tax Assessment Tax Assessment Total Assessment is a certain percentage of the fair market value that is determined by local assessors to be the total taxable value of land and additions on the property. | Land | Improvement |
|---|---|---|---|---|
| 2025 | $2,168 | $188,396 | $43,956 | $144,440 |
| 2023 | $2,142 | $181,082 | $42,250 | $138,832 |
| 2022 | $2,145 | $177,532 | $41,422 | $136,110 |
| 2021 | $2,099 | $174,052 | $40,610 | $133,442 |
| 2020 | $2,118 | $172,268 | $40,194 | $132,074 |
| 2019 | $2,060 | $168,891 | $39,406 | $129,485 |
| 2018 | $2,056 | $165,581 | $38,634 | $126,947 |
| 2017 | $1,960 | $162,335 | $37,877 | $124,458 |
| 2016 | $1,993 | $159,153 | $37,135 | $122,018 |
| 2015 | $1,926 | $156,764 | $36,578 | $120,186 |
| 2014 | $1,922 | $153,694 | $35,862 | $117,832 |
Source: Public Records
Map
Nearby Homes
- 238 W Cypress Ave
- 19317 E Parlier Ave
- 1010 D St
- 571 E Evergreen Ave
- 1903 N Sunny Ln
- 657 W Parlier Ave Unit 107
- 1405 E Cypress Ave Unit 157
- 1405 E Cypress Ave Unit 217
- 1405 E Cypress Ave Unit 137
- 2162 N East Ct
- 1205 F St
- 1966 E August Ave
- 216 S Sunset Ave
- 2055 N Riverview Ave
- 947 W Friesen Ave
- 792 E Duff Ave
- 1127 J St
- 2043 11th St
- 254 Rebel St
- 195 N Kings Dr
- 365 E Ponderosa Ave
- 319 E Ponderosa Ave
- 389 E Ponderosa Ave
- 403 E Ponderosa Ave
- 342 E Ponderosa Ave
- 318 E Ponderosa Ave
- 366 E Ponderosa Ave
- 390 E Ponderosa Ave
- 429 E Ponderosa Ave
- 339 E Sycamore Ave
- 317 E Sycamore Ave
- 418 E Ponderosa Ave
- 363 E Sycamore Ave
- 453 E Ponderosa Ave
- 440 E Ponderosa Ave
- 421 E Sycamore Ave
- 483 E Ponderosa Ave
- 483 E Ponderosa Ave
- 445 E Sycamore Ave
- 328 E Sycamore Ave