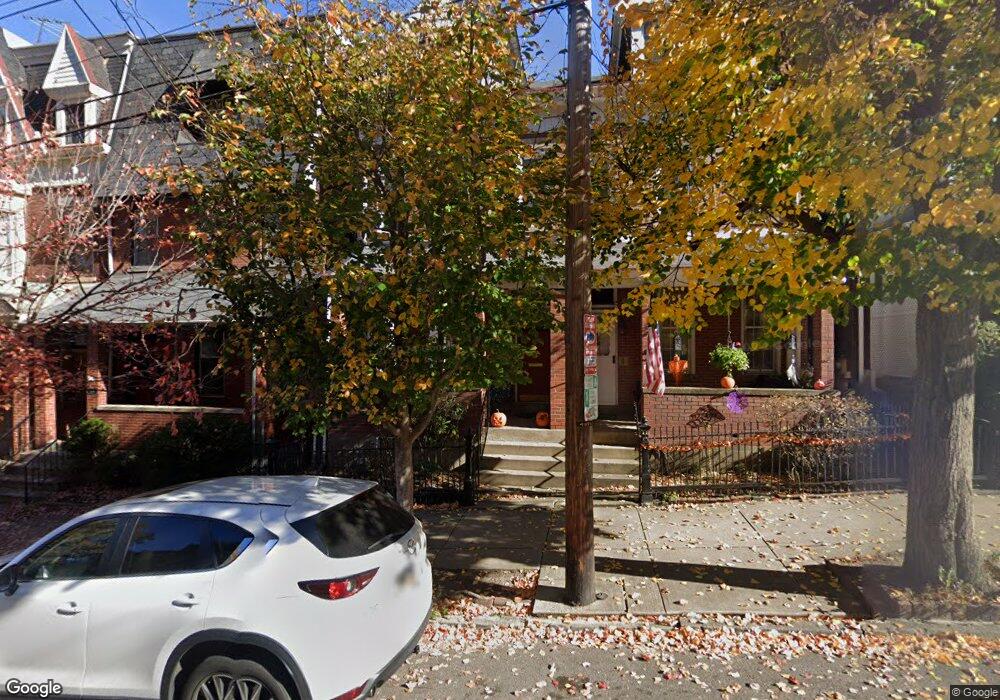
341 Fisk St Pittsburgh, PA 15201
Central Lawrenceville NeighborhoodEstimated Value: $343,133 - $702,000
4
Beds
3
Baths
1,548
Sq Ft
$345/Sq Ft
Est. Value
About This Home
This home is located at 341 Fisk St, Pittsburgh, PA 15201 and is currently estimated at $534,783, approximately $345 per square foot. 341 Fisk St is a home located in Allegheny County with nearby schools including Pittsburgh Arsenal K-5, Pittsburgh Arsenal 6-8, and Pittsburgh Milliones 6-12.
Ownership History
Date
Name
Owned For
Owner Type
Purchase Details
Closed on
Oct 4, 2005
Sold by
Farris Henry B
Bought by
Anselmo Dominick A
Current Estimated Value
Home Financials for this Owner
Home Financials are based on the most recent Mortgage that was taken out on this home.
Original Mortgage
$104,000
Outstanding Balance
$55,946
Interest Rate
5.84%
Mortgage Type
New Conventional
Estimated Equity
$478,837
Purchase Details
Closed on
May 13, 1998
Sold by
White Robert G and Bunson Alexander B
Bought by
Krutz Melissa M
Purchase Details
Closed on
Jun 26, 1995
Sold by
Gallagher Joseph E and Gallagher Mary Ellen
Bought by
White Robert G
Create a Home Valuation Report for This Property
The Home Valuation Report is an in-depth analysis detailing your home's value as well as a comparison with similar homes in the area
Home Values in the Area
Average Home Value in this Area
Purchase History
| Date | Buyer | Sale Price | Title Company |
|---|---|---|---|
| Anselmo Dominick A | $130,000 | -- | |
| Krutz Melissa M | $69,500 | -- | |
| White Robert G | $56,500 | -- |
Source: Public Records
Mortgage History
| Date | Status | Borrower | Loan Amount |
|---|---|---|---|
| Open | Anselmo Dominick A | $104,000 |
Source: Public Records
Tax History Compared to Growth
Tax History
| Year | Tax Paid | Tax Assessment Tax Assessment Total Assessment is a certain percentage of the fair market value that is determined by local assessors to be the total taxable value of land and additions on the property. | Land | Improvement |
|---|---|---|---|---|
| 2025 | $2,525 | $109,600 | $35,600 | $74,000 |
| 2024 | $2,525 | $109,600 | $35,600 | $74,000 |
| 2023 | $2,525 | $109,600 | $35,600 | $74,000 |
| 2022 | $2,492 | $109,600 | $35,600 | $74,000 |
| 2021 | $2,423 | $109,600 | $35,600 | $74,000 |
| 2020 | $2,480 | $109,600 | $35,600 | $74,000 |
| 2019 | $2,480 | $109,600 | $35,600 | $74,000 |
| 2018 | $1,897 | $109,600 | $35,600 | $74,000 |
| 2017 | $2,480 | $109,600 | $35,600 | $74,000 |
| 2016 | $518 | $109,600 | $35,600 | $74,000 |
| 2015 | $518 | $109,600 | $35,600 | $74,000 |
| 2014 | $2,425 | $109,600 | $35,600 | $74,000 |
Source: Public Records
Map
Nearby Homes