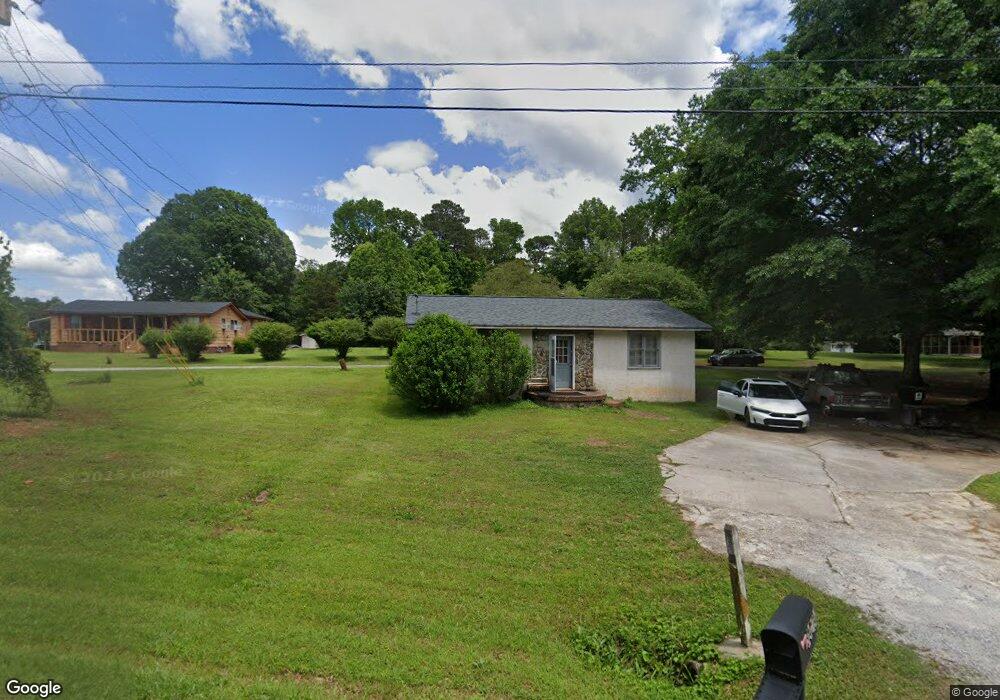
341 Herring Rd Newnan, GA 30265
Estimated Value: $276,000 - $414,000
5
Beds
2
Baths
2,642
Sq Ft
$122/Sq Ft
Est. Value
About This Home
This home is located at 341 Herring Rd, Newnan, GA 30265 and is currently estimated at $322,955, approximately $122 per square foot. 341 Herring Rd is a home located in Coweta County with nearby schools including Northside Elementary School, Madras Middle School, and Northgate High School.
Ownership History
Date
Name
Owned For
Owner Type
Purchase Details
Closed on
Sep 25, 2020
Sold by
Smith Travis Bernard
Bought by
Hayes Patsy Smith and Guillory Anna Teresa
Current Estimated Value
Purchase Details
Closed on
Nov 5, 2019
Sold by
Smith Tracy Lamar
Bought by
Hayes Patsy Smith and Guillory Anna Teresa
Purchase Details
Closed on
Aug 22, 2019
Sold by
Dennis Vivica
Bought by
Hayes Patsy Smith and Guillory Anna Teresa
Purchase Details
Closed on
Aug 19, 2019
Sold by
Smith-Gorden Wyvonnia
Bought by
Hayes Patsy Smith and Guillory Anna
Purchase Details
Closed on
Aug 7, 2019
Sold by
Harmon Clema Smith
Bought by
Hayes Patsy Smith and Guilory Anna Teresa
Purchase Details
Closed on
Aug 5, 2019
Sold by
Cannon Christie
Bought by
Hayes Patsy Smith and Guillory Anna Teresa
Purchase Details
Closed on
Jul 12, 2019
Sold by
Smith Frank
Bought by
Hayes Patsy Smith and Guillory Anna Teresa
Purchase Details
Closed on
Dec 10, 1990
Bought by
Smith Matthew and Smith Pats
Create a Home Valuation Report for This Property
The Home Valuation Report is an in-depth analysis detailing your home's value as well as a comparison with similar homes in the area
Home Values in the Area
Average Home Value in this Area
Purchase History
| Date | Buyer | Sale Price | Title Company |
|---|---|---|---|
| Hayes Patsy Smith | -- | -- | |
| Hayes Patsy Smith | -- | -- | |
| Hayes Patsy Smith | -- | -- | |
| Hayes Patsy Smith | -- | -- | |
| Hayes Patsy Smith | -- | -- | |
| Hayes Patsy Smith | -- | -- | |
| Hayes Patsy Smith | -- | -- | |
| Smith Frank | -- | -- | |
| Smith Matthew | $1,000 | -- |
Source: Public Records
Tax History Compared to Growth
Tax History
| Year | Tax Paid | Tax Assessment Tax Assessment Total Assessment is a certain percentage of the fair market value that is determined by local assessors to be the total taxable value of land and additions on the property. | Land | Improvement |
|---|---|---|---|---|
| 2024 | $942 | $83,666 | $6,970 | $76,696 |
| 2023 | $942 | $82,893 | $9,592 | $73,302 |
| 2022 | $674 | $69,736 | $6,394 | $63,342 |
| 2021 | $443 | $57,881 | $6,090 | $51,791 |
| 2020 | $1,409 | $57,881 | $6,090 | $51,791 |
| 2019 | $1,038 | $40,276 | $8,276 | $32,000 |
| 2018 | $493 | $21,594 | $8,276 | $13,318 |
| 2017 | $493 | $21,594 | $8,276 | $13,318 |
| 2016 | $489 | $21,594 | $8,276 | $13,318 |
| 2015 | $483 | $21,594 | $8,276 | $13,318 |
| 2014 | $482 | $21,594 | $8,276 | $13,318 |
Source: Public Records
Map
Nearby Homes
- 715 Herring Rd
- 2335 Highway 29n
- 890 Herring Rd
- 233 Palomino Dr
- 33 Churchill Park Dr
- 27 Churchill Park Dr
- 2337 U S 29
- 67 Seabiscuit Ct
- 63 Seabiscuit Ct
- 62 Seabiscuit Ct
- 8 Pine Ridge Dr
- 21 Riva Ridge Ln
- 4 Golf Ln
- 21 Mill Ridge Place
- 350 Brentwood Dr Unit 25
- 380 Brentwood Dr Unit 28
- 42 Club Cresswind Dr
- 2464 Highway 29 N Unit 1
- 7 Hobbitt Trail
- 21 Hawthorne Dr
- 351 Herring Rd
- 351 Herring Rd
- 315 Herring Rd
- 330 Herring Rd
- 549 Green Top Rd
- 302 Herring Rd
- 44 Poythress Rd
- 284 Herring Rd
- 535 Green Top Rd
- 50 Poythress Rd
- 270 Herring Rd
- 247 Herring Rd
- 280 Herring Rd
- 521 Green Top Rd
- 64 Poythress Rd
- 244 Herring Rd
- 96 Poythress Rd
- 256 Herring Rd
- 236 Herring Rd
- 232 Green Top Rd