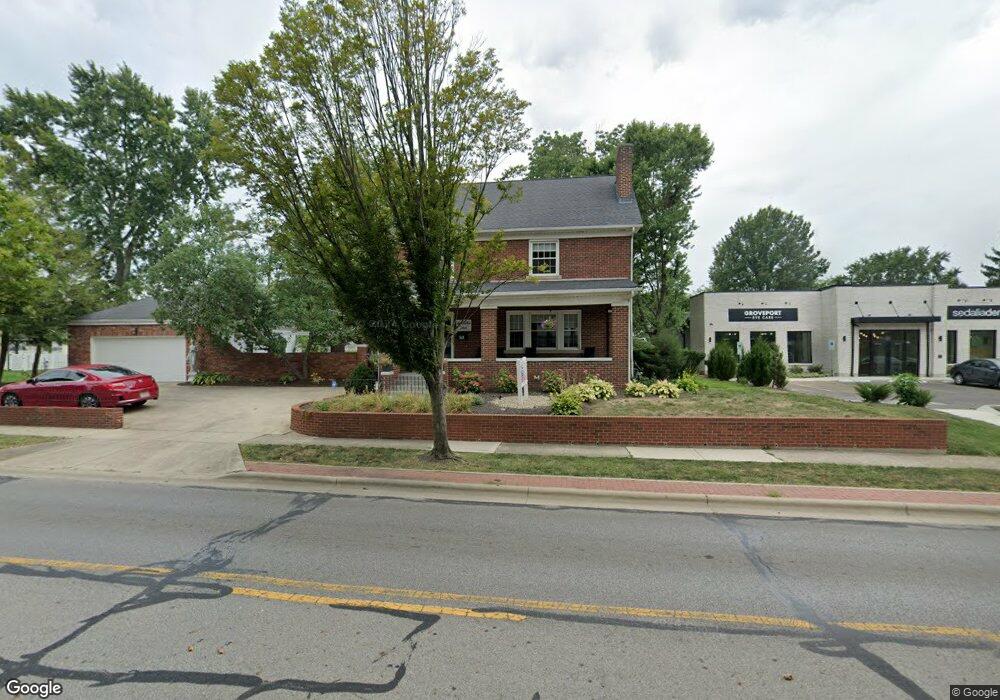
341 Main St Groveport, OH 43125
Estimated Value: $345,000 - $391,000
3
Beds
2
Baths
1,976
Sq Ft
$183/Sq Ft
Est. Value
About This Home
This home is located at 341 Main St, Groveport, OH 43125 and is currently estimated at $361,026, approximately $182 per square foot. 341 Main St is a home located in Franklin County with nearby schools including Groveport Madison High School, Groveport Community School, and Madison Christian School.
Ownership History
Date
Name
Owned For
Owner Type
Purchase Details
Closed on
Sep 2, 2019
Sold by
Finegan Jeffrey D and Finegan Kelly A
Bought by
Jkf Investments Llc
Current Estimated Value
Purchase Details
Closed on
Jul 3, 2019
Sold by
Brunner Jackie S
Bought by
Finegan Jeffrey D and Finegan Kelly A
Home Financials for this Owner
Home Financials are based on the most recent Mortgage that was taken out on this home.
Original Mortgage
$208,000
Interest Rate
3.73%
Mortgage Type
New Conventional
Purchase Details
Closed on
Aug 16, 2006
Sold by
Woodward Barbara B
Bought by
Brunner Jackie S
Purchase Details
Closed on
Jul 26, 1977
Bought by
Woodward Barbara B
Create a Home Valuation Report for This Property
The Home Valuation Report is an in-depth analysis detailing your home's value as well as a comparison with similar homes in the area
Home Values in the Area
Average Home Value in this Area
Purchase History
| Date | Buyer | Sale Price | Title Company |
|---|---|---|---|
| Jkf Investments Llc | -- | Pm Title Box | |
| Finegan Jeffrey D | $260,000 | Chicago Title | |
| Brunner Jackie S | $180,000 | Chicago Tit | |
| Woodward Barbara B | -- | -- |
Source: Public Records
Mortgage History
| Date | Status | Borrower | Loan Amount |
|---|---|---|---|
| Previous Owner | Finegan Jeffrey D | $208,000 |
Source: Public Records
Tax History Compared to Growth
Tax History
| Year | Tax Paid | Tax Assessment Tax Assessment Total Assessment is a certain percentage of the fair market value that is determined by local assessors to be the total taxable value of land and additions on the property. | Land | Improvement |
|---|---|---|---|---|
| 2024 | $5,875 | $117,470 | $30,560 | $86,910 |
| 2023 | $5,825 | $117,460 | $30,555 | $86,905 |
| 2022 | $5,488 | $88,310 | $16,660 | $71,650 |
| 2021 | $5,508 | $88,310 | $16,660 | $71,650 |
| 2020 | $5,493 | $87,850 | $16,660 | $71,190 |
| 2019 | $4,449 | $72,910 | $13,860 | $59,050 |
| 2018 | $4,188 | $72,910 | $13,860 | $59,050 |
| 2017 | $4,176 | $72,910 | $13,860 | $59,050 |
| 2016 | $3,869 | $59,020 | $11,660 | $47,360 |
| 2015 | $3,903 | $59,020 | $11,660 | $47,360 |
| 2014 | $3,674 | $59,020 | $11,660 | $47,360 |
| 2013 | $1,566 | $59,010 | $11,655 | $47,355 |
Source: Public Records
Map
Nearby Homes