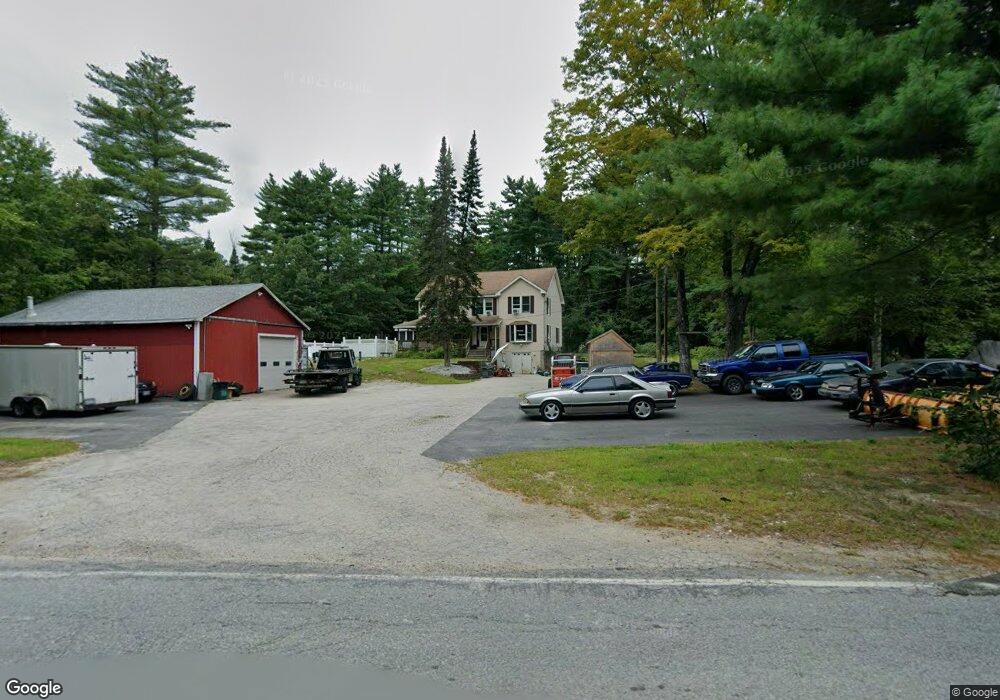
341 Mason Rd Milford, NH 03055
Estimated Value: $634,000 - $657,000
3
Beds
3
Baths
2,408
Sq Ft
$268/Sq Ft
Est. Value
About This Home
This home is located at 341 Mason Rd, Milford, NH 03055 and is currently estimated at $645,787, approximately $268 per square foot. 341 Mason Rd is a home with nearby schools including Jacques Memorial Elementary School, Heron Pond Elementary School, and Milford Middle School.
Ownership History
Date
Name
Owned For
Owner Type
Purchase Details
Closed on
Jul 29, 2021
Sold by
Harrower Raymond A
Bought by
Harrower Raymond A and Harrower Melinda R
Current Estimated Value
Home Financials for this Owner
Home Financials are based on the most recent Mortgage that was taken out on this home.
Original Mortgage
$323,200
Outstanding Balance
$294,021
Interest Rate
2.93%
Mortgage Type
Stand Alone Refi Refinance Of Original Loan
Estimated Equity
$351,766
Purchase Details
Closed on
Jun 8, 2018
Sold by
Gerrish Cheryl
Bought by
Harrower Raymond A
Home Financials for this Owner
Home Financials are based on the most recent Mortgage that was taken out on this home.
Original Mortgage
$289,750
Interest Rate
4.5%
Mortgage Type
Purchase Money Mortgage
Purchase Details
Closed on
Aug 3, 1992
Bought by
Gerrish Cheryl
Create a Home Valuation Report for This Property
The Home Valuation Report is an in-depth analysis detailing your home's value as well as a comparison with similar homes in the area
Home Values in the Area
Average Home Value in this Area
Purchase History
| Date | Buyer | Sale Price | Title Company |
|---|---|---|---|
| Harrower Raymond A | -- | None Available | |
| Harrower Raymond A | -- | None Available | |
| Harrower Raymond A | $305,000 | -- | |
| Gerrish Cheryl | $44,000 | -- | |
| Harrower Raymond A | $305,000 | -- |
Source: Public Records
Mortgage History
| Date | Status | Borrower | Loan Amount |
|---|---|---|---|
| Open | Harrower Raymond A | $323,200 | |
| Previous Owner | Harrower Raymond A | $289,750 | |
| Previous Owner | Gerrish Cheryl | $225,000 | |
| Previous Owner | Gerrish Cheryl | $230,000 |
Source: Public Records
Tax History Compared to Growth
Tax History
| Year | Tax Paid | Tax Assessment Tax Assessment Total Assessment is a certain percentage of the fair market value that is determined by local assessors to be the total taxable value of land and additions on the property. | Land | Improvement |
|---|---|---|---|---|
| 2024 | $9,915 | $418,900 | $76,800 | $342,100 |
| 2023 | $9,287 | $418,900 | $76,800 | $342,100 |
| 2022 | $8,709 | $418,900 | $76,800 | $342,100 |
| 2021 | $8,441 | $418,900 | $76,800 | $342,100 |
| 2020 | $9,780 | $385,500 | $61,800 | $323,700 |
| 2019 | $10,011 | $385,500 | $61,800 | $323,700 |
| 2018 | $9,864 | $333,200 | $61,800 | $271,400 |
| 2017 | $6,961 | $333,200 | $61,800 | $271,400 |
| 2016 | $9,649 | $333,200 | $61,800 | $271,400 |
| 2015 | $9,271 | $324,600 | $61,800 | $262,800 |
| 2014 | $8,862 | $324,600 | $61,800 | $262,800 |
| 2013 | $8,754 | $324,600 | $61,800 | $262,800 |
Source: Public Records
Map
Nearby Homes
- 294 Mason Rd
- 43 Boxwood Cir
- 415 Savage Rd
- 32 Larch Rd
- 26 Melendy Rd Unit 97
- 26 Melendy Rd Unit 42
- 0 Briar Cliff Dr
- 344 Elm St Unit 14
- 344 Elm St Unit 16
- 131 Badger Hill Dr
- Lot F-88-9 Aria Hill Dr
- F-88-7 Aria Hill Dr
- F-88-12 Aria Hill Dr
- F-88-11 Aria Hill Dr
- F-88-10 Aria Hill Dr
- 24 Spaulding St
- 44 Osgood Rd
- 00 Ruonala Rd
- 134 Falcon Ridge Rd Unit 23
- 686 Route 13 S