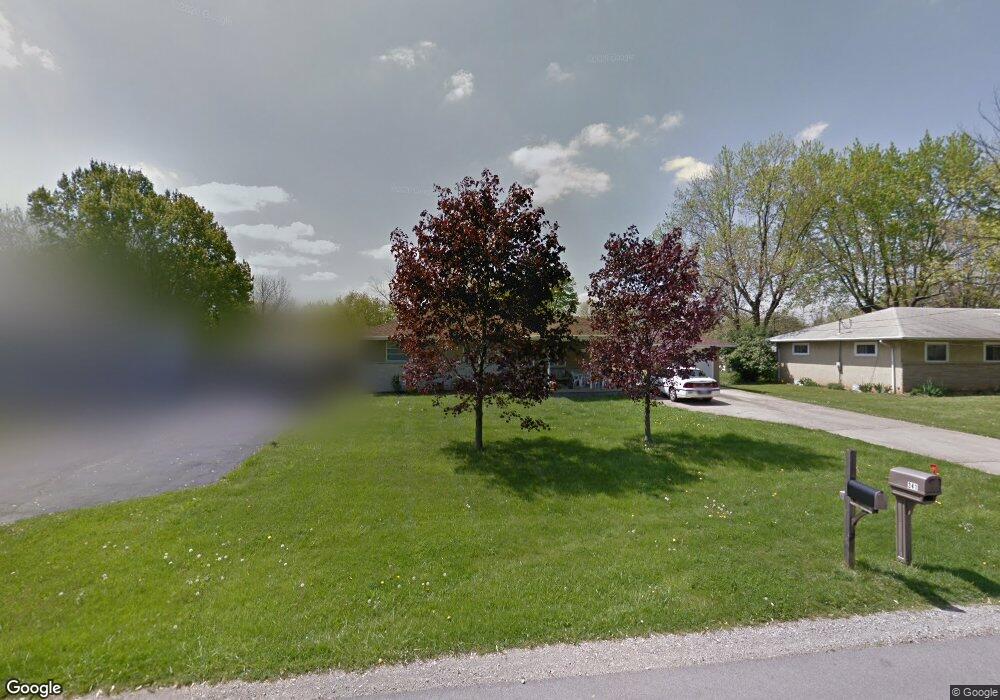
341 N Grener Ave Columbus, OH 43228
Estimated Value: $225,000 - $257,000
4
Beds
2
Baths
1,080
Sq Ft
$224/Sq Ft
Est. Value
About This Home
This home is located at 341 N Grener Ave, Columbus, OH 43228 and is currently estimated at $242,058, approximately $224 per square foot. 341 N Grener Ave is a home located in Franklin County with nearby schools including Prairie Lincoln Elementary School, Galloway Ridge Intermediate School, and Norton Middle School.
Ownership History
Date
Name
Owned For
Owner Type
Purchase Details
Closed on
Aug 7, 2020
Sold by
Burns James E and Burns Kelly R
Bought by
Sothard Kelly R and Sothard Craig S
Current Estimated Value
Home Financials for this Owner
Home Financials are based on the most recent Mortgage that was taken out on this home.
Original Mortgage
$111,925
Outstanding Balance
$98,913
Interest Rate
2.8%
Mortgage Type
FHA
Estimated Equity
$143,145
Purchase Details
Closed on
Jan 7, 2010
Sold by
Thompson Edgar A and Thompson Barbara S
Bought by
Burns James E and Burns Kelly R
Purchase Details
Closed on
Apr 1, 1996
Sold by
Davis Andrew
Bought by
Thompson Edgar A and Thompson Barbara S
Home Financials for this Owner
Home Financials are based on the most recent Mortgage that was taken out on this home.
Original Mortgage
$73,200
Interest Rate
6.98%
Mortgage Type
New Conventional
Purchase Details
Closed on
Sep 29, 1992
Purchase Details
Closed on
Aug 26, 1991
Create a Home Valuation Report for This Property
The Home Valuation Report is an in-depth analysis detailing your home's value as well as a comparison with similar homes in the area
Home Values in the Area
Average Home Value in this Area
Purchase History
| Date | Buyer | Sale Price | Title Company |
|---|---|---|---|
| Sothard Kelly R | -- | Columbus Title Agency | |
| Burns James E | $70,100 | None Available | |
| Thompson Edgar A | $91,500 | -- | |
| -- | $86,900 | -- | |
| -- | $80,500 | -- |
Source: Public Records
Mortgage History
| Date | Status | Borrower | Loan Amount |
|---|---|---|---|
| Open | Sothard Kelly R | $111,925 | |
| Previous Owner | Thompson Edgar A | $73,200 |
Source: Public Records
Tax History Compared to Growth
Tax History
| Year | Tax Paid | Tax Assessment Tax Assessment Total Assessment is a certain percentage of the fair market value that is determined by local assessors to be the total taxable value of land and additions on the property. | Land | Improvement |
|---|---|---|---|---|
| 2024 | $3,173 | $65,590 | $15,890 | $49,700 |
| 2023 | $3,037 | $65,590 | $15,890 | $49,700 |
| 2022 | $2,758 | $41,510 | $5,950 | $35,560 |
| 2021 | $2,799 | $41,510 | $5,950 | $35,560 |
| 2020 | $2,787 | $41,510 | $5,950 | $35,560 |
| 2019 | $2,792 | $36,330 | $4,970 | $31,360 |
| 2018 | $2,446 | $36,330 | $4,970 | $31,360 |
| 2017 | $2,471 | $36,330 | $4,970 | $31,360 |
| 2016 | $2,295 | $28,350 | $6,230 | $22,120 |
| 2015 | $2,108 | $28,350 | $6,230 | $22,120 |
| 2014 | $2,132 | $28,350 | $6,230 | $22,120 |
| 2013 | $1,228 | $33,355 | $7,315 | $26,040 |
Source: Public Records
Map
Nearby Homes
- 481 N Grener Ave
- 399 Carilla Ln
- 139 Garden Heights Ave
- 106 N Grener Ave
- 106 Tarryton Ct E Unit 8C
- 141 Beacon Run W Unit 26E
- 4696 Tarryton Ct S Unit 7-3G
- 74 Tarryton Ct E Unit 10A
- 4714 Tarryton Ct S Unit 20-3F
- 127 Tarryton Ct W Unit 23D
- 2867 Kobuk Dr Unit 404
- 2867 Kobuk Dr Unit 402
- 2867 Kobuk Dr Unit 303
- 2867 Kobuk Dr Unit 201
- 2867 Kobuk Dr Unit 403
- 4657 Arnold Ave
- 105 Redmond Rd
- 4736 Palmetto St
- 144 Woodlawn Ave
- 299 Lombard Rd
- 325 N Grener Ave
- 349 N Grener Ave
- 321 N Grener Ave
- 326 N Grener Ave
- 350 N Grener Ave
- 305 N Grener Ave
- 320 N Grener Ave
- 310 N Grener Ave
- 340 Old Village Rd
- 4461 Haldy Rd
- 332 Old Village Rd
- 354 Old Village Rd
- 371 N Grener Ave
- 324 Old Village Rd
- 304 N Grener Ave
- 362 N Grener Ave
- 316 Old Village Rd
- 285 N Grener Ave
- 4445 Haldy Rd
- 379 N Grener Ave