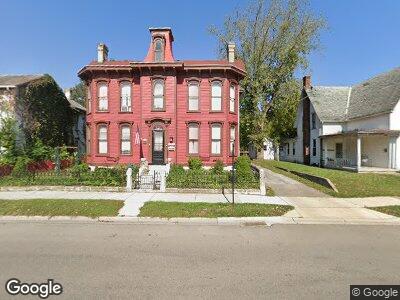
341 N Main St Miamisburg, OH 45342
Downtown Miamisburg NeighborhoodEstimated Value: $210,000 - $287,000
5
Beds
3
Baths
3,084
Sq Ft
$79/Sq Ft
Est. Value
About This Home
This home is located at 341 N Main St, Miamisburg, OH 45342 and is currently estimated at $244,667, approximately $79 per square foot. 341 N Main St is a home located in Montgomery County with nearby schools including Miamisburg High School and Bethel Baptist School.
Ownership History
Date
Name
Owned For
Owner Type
Purchase Details
Closed on
Aug 12, 2016
Sold by
Aldineh Yaser M and Aldineh Jill
Bought by
Miller Glen W
Current Estimated Value
Purchase Details
Closed on
Nov 20, 2014
Sold by
Aldineh Yaser
Bought by
Miller Glen W
Purchase Details
Closed on
Apr 27, 2011
Sold by
Hsbc Mortgage Services Inc
Bought by
Aldineh Yaser M
Home Financials for this Owner
Home Financials are based on the most recent Mortgage that was taken out on this home.
Original Mortgage
$254,100
Interest Rate
4.67%
Mortgage Type
Unknown
Purchase Details
Closed on
Aug 12, 2010
Sold by
Konzen Kevin and Konzen Teresa
Bought by
Hsbc Mortgage Services Inc
Purchase Details
Closed on
Dec 11, 1998
Sold by
Clements Troy S
Bought by
Konzen Kevin and Konzen Teresa
Home Financials for this Owner
Home Financials are based on the most recent Mortgage that was taken out on this home.
Original Mortgage
$168,300
Interest Rate
6.83%
Create a Home Valuation Report for This Property
The Home Valuation Report is an in-depth analysis detailing your home's value as well as a comparison with similar homes in the area
Home Values in the Area
Average Home Value in this Area
Purchase History
| Date | Buyer | Sale Price | Title Company |
|---|---|---|---|
| Miller Glen W | $25,000 | Fidelity Lawyers Title Agenc | |
| Miller Glen W | $25,000 | None Available | |
| Aldineh Yaser M | $50,000 | Attorney | |
| Hsbc Mortgage Services Inc | -- | Sovereign Title Agency Llc | |
| Konzen Kevin | $198,900 | Superior Title | |
| Clements Troy S | $155,000 | Superior Title |
Source: Public Records
Mortgage History
| Date | Status | Borrower | Loan Amount |
|---|---|---|---|
| Open | Miller Glen W | $412,500 | |
| Closed | Miller Glen W | $412,500 | |
| Previous Owner | Aldineh Yaser M | $254,100 | |
| Previous Owner | Konzen Kevin | $215,000 | |
| Previous Owner | Clements Troy S | $168,300 |
Source: Public Records
Tax History Compared to Growth
Tax History
| Year | Tax Paid | Tax Assessment Tax Assessment Total Assessment is a certain percentage of the fair market value that is determined by local assessors to be the total taxable value of land and additions on the property. | Land | Improvement |
|---|---|---|---|---|
| 2024 | $3,774 | $54,080 | $7,060 | $47,020 |
| 2023 | $3,774 | $54,080 | $7,060 | $47,020 |
| 2022 | $3,171 | $37,550 | $4,900 | $32,650 |
| 2021 | $2,775 | $36,500 | $4,900 | $31,600 |
| 2020 | $3,825 | $52,490 | $4,900 | $47,590 |
| 2019 | $1,485 | $15,650 | $4,900 | $10,750 |
| 2018 | $1,489 | $15,650 | $4,900 | $10,750 |
| 2017 | $1,481 | $15,650 | $4,900 | $10,750 |
| 2016 | $3,814 | $45,180 | $4,900 | $40,280 |
| 2015 | $3,747 | $45,180 | $4,900 | $40,280 |
| 2014 | $3,747 | $45,180 | $4,900 | $40,280 |
| 2012 | -- | $51,100 | $6,810 | $44,290 |
Source: Public Records
Map
Nearby Homes
- 434 Buckeye St
- 532 E Pearl St
- 543 Buckeye St
- 615 E Pearl St
- 105 S 2nd St
- 714 E Pearl St
- 7 N Riverview Ave
- 20 S 7th St
- 819 E Maple Ave
- 740 E Central Ave
- 224 Suttman St
- 125 N 10th St
- 1225 N 8th St
- 12 Center St
- 434 S 2nd St Unit 432
- 20 N 10th St
- 306 S 7th St
- 1134 Kehm St
- 631 Upper Miamisburg Rd
- 734 N 11th St