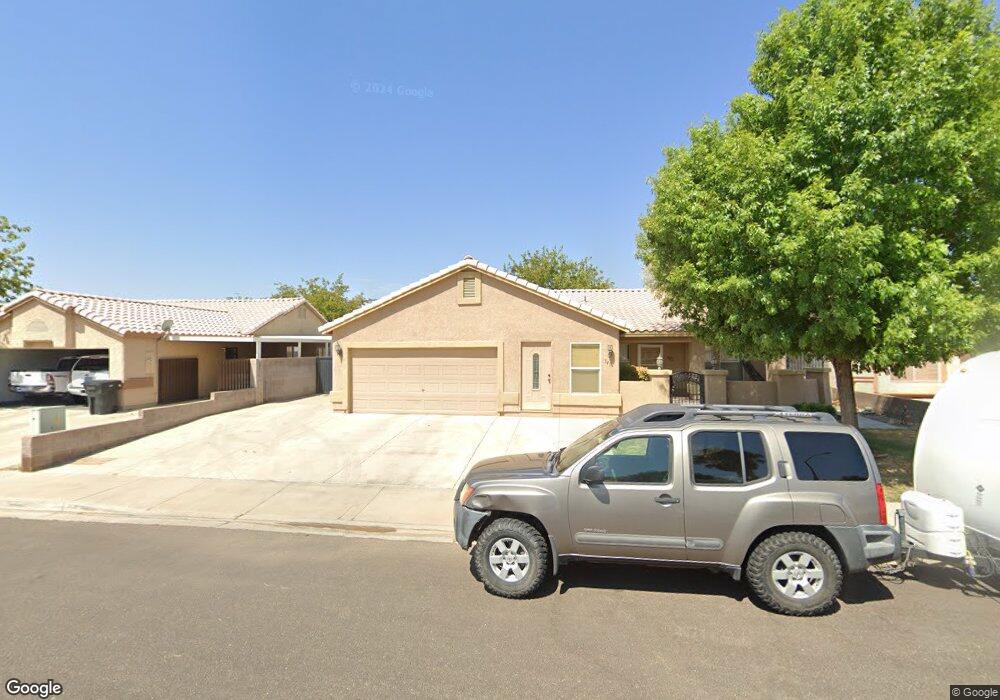
341 Verllonia St Mesquite, NV 89027
Estimated Value: $382,348 - $492,000
5
Beds
3
Baths
1,792
Sq Ft
$239/Sq Ft
Est. Value
About This Home
This home is located at 341 Verllonia St, Mesquite, NV 89027 and is currently estimated at $429,087, approximately $239 per square foot. 341 Verllonia St is a home located in Clark County with nearby schools including Virgin Valley Elementary School, Charles Arthur Hughes Middle School, and Virgin Valley High School.
Ownership History
Date
Name
Owned For
Owner Type
Purchase Details
Closed on
Apr 3, 2009
Sold by
Pinto Cesar O and Pinto Sonia A
Bought by
Purner Peggy A
Current Estimated Value
Home Financials for this Owner
Home Financials are based on the most recent Mortgage that was taken out on this home.
Original Mortgage
$180,630
Outstanding Balance
$114,493
Interest Rate
4.99%
Mortgage Type
Unknown
Estimated Equity
$314,594
Purchase Details
Closed on
Nov 18, 2005
Sold by
Robie Ronald A and Robie Sharon L
Bought by
Pinto Cesar O and Pinto Sonia A
Home Financials for this Owner
Home Financials are based on the most recent Mortgage that was taken out on this home.
Original Mortgage
$250,000
Interest Rate
6.14%
Mortgage Type
Fannie Mae Freddie Mac
Purchase Details
Closed on
Jan 16, 1998
Sold by
Dane William N
Bought by
Robie Ronald A and Robie Sharon L
Create a Home Valuation Report for This Property
The Home Valuation Report is an in-depth analysis detailing your home's value as well as a comparison with similar homes in the area
Home Values in the Area
Average Home Value in this Area
Purchase History
| Date | Buyer | Sale Price | Title Company |
|---|---|---|---|
| Purner Peggy A | $200,700 | Equity Title Eastern | |
| Pinto Cesar O | $260,000 | Equity Title Of Nevada | |
| Robie Ronald A | $125,000 | Fidelity National Title |
Source: Public Records
Mortgage History
| Date | Status | Borrower | Loan Amount |
|---|---|---|---|
| Open | Purner Peggy A | $180,630 | |
| Previous Owner | Pinto Cesar O | $250,000 |
Source: Public Records
Tax History Compared to Growth
Tax History
| Year | Tax Paid | Tax Assessment Tax Assessment Total Assessment is a certain percentage of the fair market value that is determined by local assessors to be the total taxable value of land and additions on the property. | Land | Improvement |
|---|---|---|---|---|
| 2025 | $1,686 | $98,123 | $26,075 | $72,048 |
| 2024 | $1,638 | $98,123 | $26,075 | $72,048 |
| 2023 | $1,638 | $93,474 | $25,200 | $68,274 |
| 2022 | $1,590 | $83,518 | $21,000 | $62,518 |
| 2021 | $1,544 | $77,144 | $17,500 | $59,644 |
| 2020 | $1,497 | $74,515 | $15,400 | $59,115 |
| 2019 | $1,454 | $73,831 | $15,400 | $58,431 |
| 2018 | $1,411 | $69,249 | $12,950 | $56,299 |
| 2017 | $1,923 | $69,332 | $12,250 | $57,082 |
| 2016 | $1,336 | $62,391 | $9,800 | $52,591 |
| 2015 | $1,333 | $65,264 | $8,750 | $56,514 |
| 2014 | $1,294 | $45,296 | $8,750 | $36,546 |
Source: Public Records
Map
Nearby Homes
- 375 Habib Way
- 294 Sam Way
- 364 Sam Way
- 287 Sam Way
- 463 Hagens Aly
- Beckett Plan at The Fields
- Weston Plan at The Fields
- Graham Plan at The Fields
- 254 Reber Dr
- 777 2nd St S
- 271 Concord Dr
- 228 Hiawatha Way
- 162 Hermosa Way
- 871 Falcon Glenn Dr
- 844 Sagedell Rd
- 844 Glendale Rd
- 262 Thistle St
- 517 W Mesquite Blvd
- 468 Apogee Crest St
- 479 Apogee Crest St
- 331 Verllonia St
- 351 Verllonia St
- 880 Wasi Ln
- 321 Verllonia St
- 361 Verllonia St
- 889 Amina Cir
- 342 Verllonia St
- 890 Wasi Ln
- 332 Verllonia St Unit 5
- 352 Verllonia St
- 879 Amina Cir
- 311 Verllonia St
- 371 Verllonia St
- 322 Verllonia St
- 362 Verllonia St
- 324 Gloria Way
- 312 Verllonia St
- 372 Verllonia St
- 900 Wasi Ln
- 381 Verllonia St