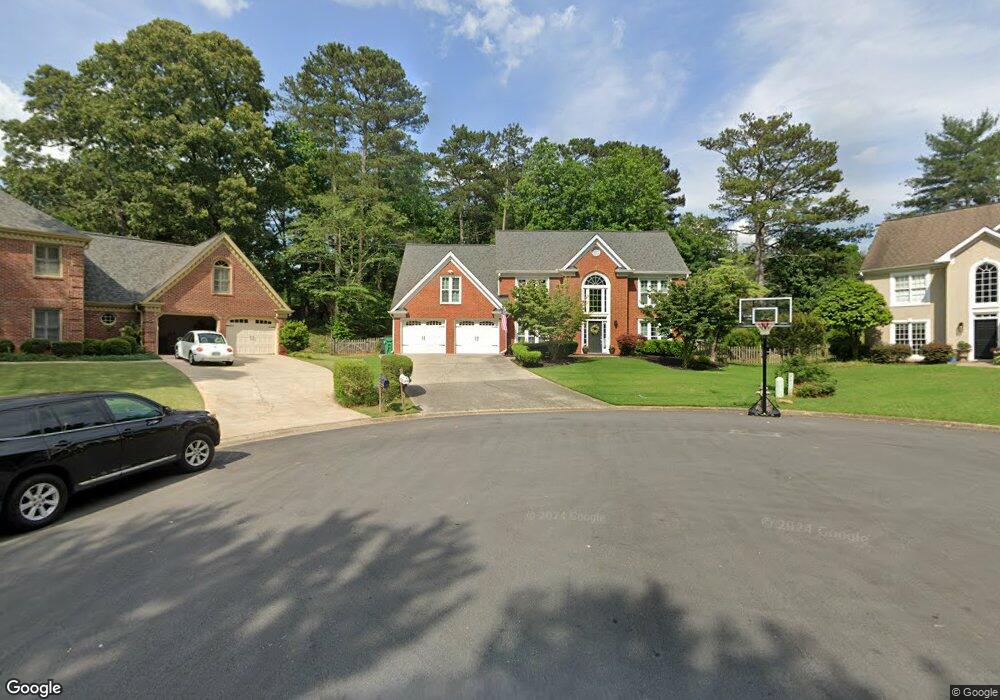
3410 Cranborne Chase Marietta, GA 30062
East Cobb NeighborhoodEstimated Value: $723,000 - $792,000
4
Beds
3
Baths
3,322
Sq Ft
$227/Sq Ft
Est. Value
About This Home
This home is located at 3410 Cranborne Chase, Marietta, GA 30062 and is currently estimated at $752,542, approximately $226 per square foot. 3410 Cranborne Chase is a home located in Cobb County with nearby schools including Shallowford Falls Elementary School, Hightower Trail Middle School, and Pope High School.
Ownership History
Date
Name
Owned For
Owner Type
Purchase Details
Closed on
Apr 15, 2016
Sold by
Mccoy Lawrence
Bought by
Mccoy Patricia M
Current Estimated Value
Home Financials for this Owner
Home Financials are based on the most recent Mortgage that was taken out on this home.
Original Mortgage
$252,200
Outstanding Balance
$109,136
Interest Rate
3.73%
Mortgage Type
New Conventional
Estimated Equity
$643,406
Purchase Details
Closed on
Oct 29, 1999
Sold by
Taylor Nanette K
Bought by
Mccoy Lawrence and Mccoy Patricia M
Home Financials for this Owner
Home Financials are based on the most recent Mortgage that was taken out on this home.
Original Mortgage
$230,850
Interest Rate
7.76%
Mortgage Type
New Conventional
Create a Home Valuation Report for This Property
The Home Valuation Report is an in-depth analysis detailing your home's value as well as a comparison with similar homes in the area
Home Values in the Area
Average Home Value in this Area
Purchase History
| Date | Buyer | Sale Price | Title Company |
|---|---|---|---|
| Mccoy Patricia M | -- | -- | |
| Mccoy Lawrence | $243,000 | -- |
Source: Public Records
Mortgage History
| Date | Status | Borrower | Loan Amount |
|---|---|---|---|
| Open | Mccoy Patricia M | $252,200 | |
| Previous Owner | Mccoy Lawrence | $230,850 |
Source: Public Records
Tax History Compared to Growth
Tax History
| Year | Tax Paid | Tax Assessment Tax Assessment Total Assessment is a certain percentage of the fair market value that is determined by local assessors to be the total taxable value of land and additions on the property. | Land | Improvement |
|---|---|---|---|---|
| 2025 | $5,801 | $246,860 | $60,000 | $186,860 |
| 2024 | $5,806 | $246,860 | $60,000 | $186,860 |
| 2023 | $5,261 | $246,716 | $53,200 | $193,516 |
| 2022 | $4,975 | $206,716 | $46,000 | $160,716 |
| 2021 | $4,299 | $175,812 | $44,000 | $131,812 |
| 2020 | $4,299 | $175,812 | $44,000 | $131,812 |
| 2019 | $4,299 | $175,812 | $44,000 | $131,812 |
| 2018 | $4,038 | $163,904 | $46,800 | $117,104 |
| 2017 | $3,926 | $163,904 | $46,800 | $117,104 |
| 2016 | $3,586 | $148,120 | $46,800 | $101,320 |
| 2015 | $3,658 | $148,120 | $46,800 | $101,320 |
| 2014 | $3,680 | $148,120 | $0 | $0 |
Source: Public Records
Map
Nearby Homes
- 3222 Bluff Rd
- 3148 Cherbourg Ct
- 3447 Dry Creek Rd
- 3333 N Hembree Rd
- 2961 Connie St
- 3503 Liberty Ridge Trail
- 2872 Suffolk Ct
- 2864 Sudbury Ct
- 3461 Salem Trace
- 2866 Lexington Trace
- 3160 Running Cedar Dr
- 3400 Williams Rd
- 3701 Shallowford Rd
- 3605 Shallowford Rd
- 3273 Carriage Way
- 3262 Carriage Way
- 2950 Windrose Dr
- 2760 Hembree Rd NE
- 3409 Cranborne Chase
- 3408 Cranborne Chase
- 3411 Kingsbere Trace
- 3152 Bluff Rd
- 3414 Kingsbere Trace
- 3406 Cranborne Chase
- 3682 Hembree Ln
- 3162 Bluff Rd
- 3407 Cranborne Chase
- 3686 Hembree Ln
- 3404 Cranborne Chase
- 3435 Weymouth Ct Unit 1
- 3540 Dry Creek Rd
- 3678 Hembree Ln
- 3412 Kingsbere Trace
- 3433 Weymouth Ct
- 3172 Bluff Rd
- 3405 Cranborne Chase Unit 4
- 3437 Weymouth Ct Unit 6
- 3437 Weymouth Ct