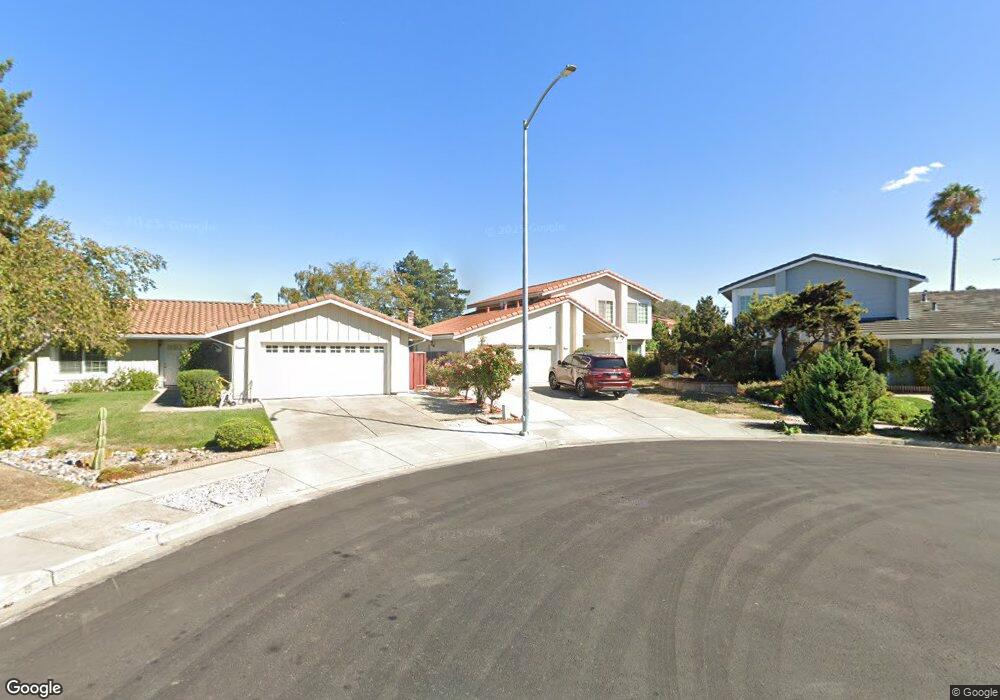
3410 Lake Chad Ct Fremont, CA 94555
Alvarado NeighborhoodEstimated Value: $1,904,000 - $2,011,000
4
Beds
3
Baths
2,052
Sq Ft
$957/Sq Ft
Est. Value
About This Home
This home is located at 3410 Lake Chad Ct, Fremont, CA 94555 and is currently estimated at $1,963,186, approximately $956 per square foot. 3410 Lake Chad Ct is a home located in Alameda County with nearby schools including Warwick Elementary School, Thornton Middle School, and American High School.
Ownership History
Date
Name
Owned For
Owner Type
Purchase Details
Closed on
Mar 1, 2011
Sold by
Martinez Ralph and Martinez Consuelo
Bought by
Leung Donald D and Yip Agnes H
Current Estimated Value
Home Financials for this Owner
Home Financials are based on the most recent Mortgage that was taken out on this home.
Original Mortgage
$566,761
Outstanding Balance
$388,686
Interest Rate
4.75%
Mortgage Type
FHA
Estimated Equity
$1,574,500
Purchase Details
Closed on
Dec 15, 1999
Sold by
Martinez Ralph and Martinez Consuelo
Bought by
Martinez Ralph and Martinez Consuelo
Purchase Details
Closed on
Jul 21, 1995
Sold by
Trovao Alfred
Bought by
Gomes Cecilia M
Home Financials for this Owner
Home Financials are based on the most recent Mortgage that was taken out on this home.
Original Mortgage
$145,000
Interest Rate
7.59%
Purchase Details
Closed on
Jul 17, 1995
Sold by
Gomes Cecilia M
Bought by
Martinez Ralph and Martinez Consuelo
Home Financials for this Owner
Home Financials are based on the most recent Mortgage that was taken out on this home.
Original Mortgage
$145,000
Interest Rate
7.59%
Create a Home Valuation Report for This Property
The Home Valuation Report is an in-depth analysis detailing your home's value as well as a comparison with similar homes in the area
Home Values in the Area
Average Home Value in this Area
Purchase History
| Date | Buyer | Sale Price | Title Company |
|---|---|---|---|
| Leung Donald D | $623,500 | Old Republic Title Company | |
| Martinez Ralph | -- | -- | |
| Gomes Cecilia M | -- | Chicago Title Company | |
| Martinez Ralph | $237,500 | Chicago Title Company |
Source: Public Records
Mortgage History
| Date | Status | Borrower | Loan Amount |
|---|---|---|---|
| Open | Leung Donald D | $566,761 | |
| Previous Owner | Martinez Ralph | $145,000 |
Source: Public Records
Tax History Compared to Growth
Tax History
| Year | Tax Paid | Tax Assessment Tax Assessment Total Assessment is a certain percentage of the fair market value that is determined by local assessors to be the total taxable value of land and additions on the property. | Land | Improvement |
|---|---|---|---|---|
| 2025 | $9,692 | $798,765 | $239,629 | $559,136 |
| 2024 | $9,692 | $783,108 | $234,932 | $548,176 |
| 2023 | $9,432 | $767,758 | $230,327 | $537,431 |
| 2022 | $9,309 | $752,707 | $225,812 | $526,895 |
| 2021 | $9,082 | $737,948 | $221,384 | $516,564 |
| 2020 | $9,103 | $730,385 | $219,115 | $511,270 |
| 2019 | $9,000 | $716,070 | $214,821 | $501,249 |
| 2018 | $8,825 | $702,035 | $210,610 | $491,425 |
| 2017 | $8,605 | $688,274 | $206,482 | $481,792 |
| 2016 | $8,459 | $674,782 | $202,434 | $472,348 |
| 2015 | $8,347 | $664,650 | $199,395 | $465,255 |
| 2014 | $8,204 | $651,631 | $195,489 | $456,142 |
Source: Public Records
Map
Nearby Homes
- 3501 Lake Ontario Dr
- 33010 Lake Mead Dr
- 32542 Lake Tana St
- 33162 Lake Pyramid St
- 167 Kona Cir
- 328 Waikiki Cir
- 32625 Brenda Way Unit 1
- 3178 Santa Marta Ct
- 192 Hawaii Cir
- 33228 Jamie Cir
- 33283 Sunriver Common
- 4243 Comet Cir
- 4100 Aquarius Cir
- 4231 Hanford St
- 30 Palm Dr Unit 30
- 4272 Warbler Loop
- 2716 Killdeer Ct
- 4214 Saturn Way
- 2469 Ascot Way
- 3480 Oriole Place
- 3400 Lake Chad Ct
- 3420 Lake Chad Ct
- 3409 Lake Arrowhead Ave
- 3399 Lake Arrowhead Ave
- 3160 Grand Lake Dr
- 3419 Lake Arrowhead Ave
- 3182 Grand Lake Dr
- 3142 Grand Lake Dr
- 3411 Lake Chad Ct
- 3430 Lake Chad Ct
- 3224 Grand Lake Dr
- 3122 Grand Lake Dr
- 3429 Lake Arrowhead Ave
- 3246 Grand Lake Dr
- 3421 Lake Chad Ct
- 3268 Grand Lake Dr
- 3431 Lake Chad Ct
- 32646 Lake Chad St
- 32634 Lake Chad St
- 32640 Shaver Lake St