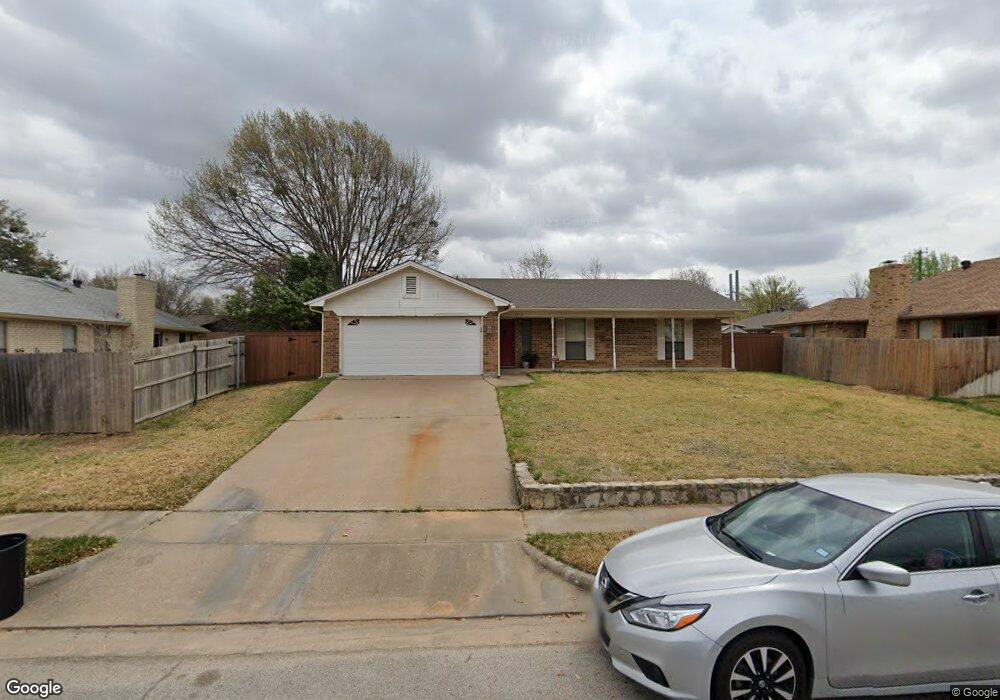
3412 Murphy Dr Bedford, TX 76021
Estimated Value: $346,000 - $359,000
3
Beds
2
Baths
1,382
Sq Ft
$254/Sq Ft
Est. Value
About This Home
This home is located at 3412 Murphy Dr, Bedford, TX 76021 and is currently estimated at $350,378, approximately $253 per square foot. 3412 Murphy Dr is a home located in Tarrant County with nearby schools including Spring Garden Elementary School, Harwood Junior High School, and Trinity High School.
Ownership History
Date
Name
Owned For
Owner Type
Purchase Details
Closed on
Nov 13, 2001
Sold by
Green Bettye J
Bought by
Eadie Alan J
Current Estimated Value
Home Financials for this Owner
Home Financials are based on the most recent Mortgage that was taken out on this home.
Original Mortgage
$94,000
Outstanding Balance
$36,388
Interest Rate
6.59%
Estimated Equity
$313,990
Purchase Details
Closed on
Jun 24, 1999
Sold by
Rix Nanette L
Bought by
Green Bettye J
Home Financials for this Owner
Home Financials are based on the most recent Mortgage that was taken out on this home.
Original Mortgage
$81,520
Interest Rate
6.65%
Purchase Details
Closed on
May 24, 1996
Sold by
Hancock John Olin and Hancock Valeria Sue
Bought by
Rix Nanette L
Home Financials for this Owner
Home Financials are based on the most recent Mortgage that was taken out on this home.
Original Mortgage
$84,600
Interest Rate
8.06%
Create a Home Valuation Report for This Property
The Home Valuation Report is an in-depth analysis detailing your home's value as well as a comparison with similar homes in the area
Home Values in the Area
Average Home Value in this Area
Purchase History
| Date | Buyer | Sale Price | Title Company |
|---|---|---|---|
| Eadie Alan J | -- | Allegiance Title Company | |
| Green Bettye J | -- | Commonwealth Land Title | |
| Rix Nanette L | -- | American Title Company |
Source: Public Records
Mortgage History
| Date | Status | Borrower | Loan Amount |
|---|---|---|---|
| Open | Eadie Alan J | $94,000 | |
| Previous Owner | Green Bettye J | $81,520 | |
| Previous Owner | Rix Nanette L | $84,600 | |
| Closed | Green Bettye J | $10,190 | |
| Closed | Eadie Alan J | $11,750 |
Source: Public Records
Tax History Compared to Growth
Tax History
| Year | Tax Paid | Tax Assessment Tax Assessment Total Assessment is a certain percentage of the fair market value that is determined by local assessors to be the total taxable value of land and additions on the property. | Land | Improvement |
|---|---|---|---|---|
| 2025 | $4,195 | $312,463 | $70,000 | $242,463 |
| 2024 | $4,195 | $312,463 | $70,000 | $242,463 |
| 2023 | $5,499 | $325,809 | $45,000 | $280,809 |
| 2022 | $5,693 | $260,644 | $45,000 | $215,644 |
| 2021 | $5,717 | $254,759 | $45,000 | $209,759 |
| 2020 | $5,246 | $231,641 | $45,000 | $186,641 |
| 2019 | $4,873 | $239,947 | $45,000 | $194,947 |
| 2018 | $4,048 | $182,347 | $45,000 | $137,347 |
| 2017 | $4,010 | $199,913 | $30,000 | $169,913 |
| 2016 | $3,646 | $172,575 | $30,000 | $142,575 |
| 2015 | $3,165 | $137,000 | $18,000 | $119,000 |
| 2014 | $3,165 | $137,000 | $18,000 | $119,000 |
Source: Public Records
Map
Nearby Homes
- 3017 Bluebonnet Ln
- 3405 Scenic Hills Dr
- 3816 Rolling Meadows Dr
- 3721 Fieldcrest Ln
- 3713 Teal Ln
- 3013 Bent Tree Ln
- 3024 Pecan Cir
- 2609 Talisman Ct
- 3152 Woodbridge Dr
- 3001 Glenwood Ct
- 2305 Meadowlark Ln
- 3909 Allendale St
- Seaberry II Plan at Grace Park - Signature Series
- Primrose FE V Plan at Grace Park - Signature Series
- Hawthorne Plan at Grace Park - Signature Series
- Seaberry Plan at Grace Park - Signature Series
- Gardenia Plan at Grace Park - Signature Series
- Bellflower IV Plan at Grace Park - Signature Series
- Bellflower II Plan at Grace Park - Signature Series
- Carolina IV Plan at Grace Park - Signature Series
- 2801 Bluebonnet Ln
- 2800 Jasmine Ct
- 2805 Bluebonnet Ln
- 2804 Jasmine Ct
- 2809 Bluebonnet Ln
- 2808 Jasmine Ct
- 3417 Murphy Dr
- 3413 Murphy Dr
- 3421 Murphy Dr
- 3409 Murphy Dr
- 2813 Bluebonnet Ln
- 3425 Murphy Dr
- 2801 Jasmine Ct
- 2804 Bluebonnet Ln
- 3405 Murphy Dr
- 2805 Jasmine Ct
- 2808 Bluebonnet Ln
- 3429 Murphy Dr
- 2817 Bluebonnet Ln
- 2817 Jasmine Ct