
3412 Pointe Creek Ct Unit 102 Bonita Springs, FL 34134
Pelican Landing NeighborhoodHighlights
- Beach Access
- Fitness Center
- Gated Community
- Pinewoods Elementary School Rated A-
- Basketball Court
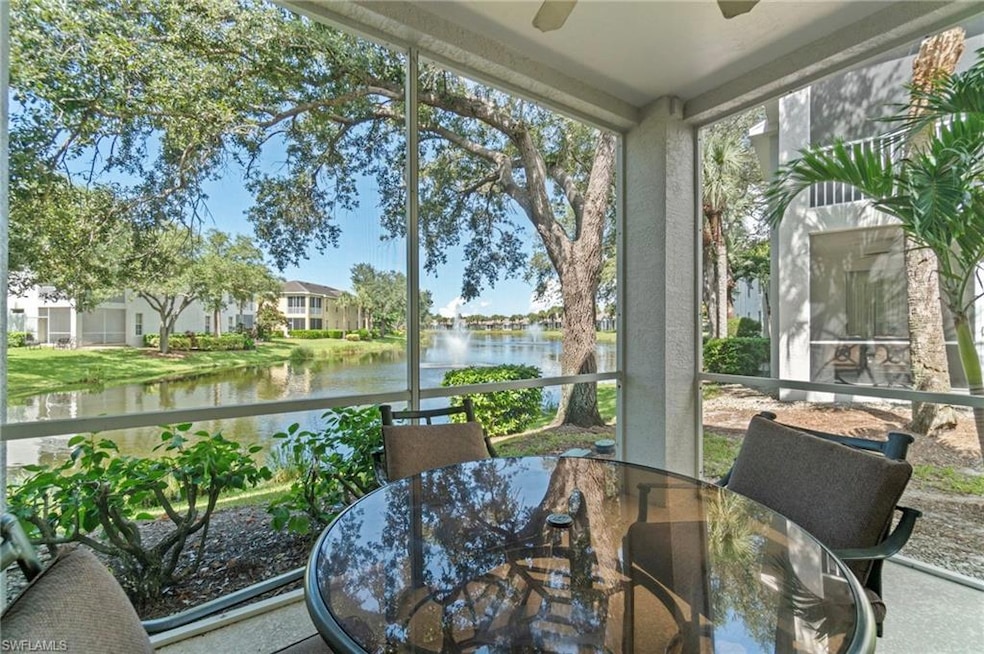
- Lake View
About This Home
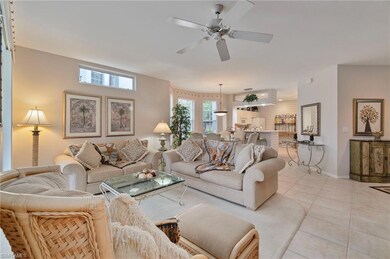
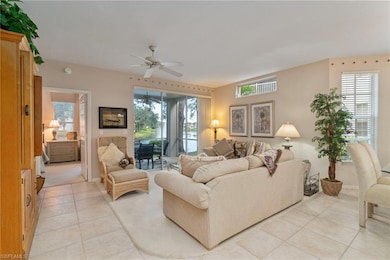
NEW! AVAILABLE FALL 2025 & WINTER 2026! The Pointe at Pelican Landing | Spacious Lakeview Retreat |
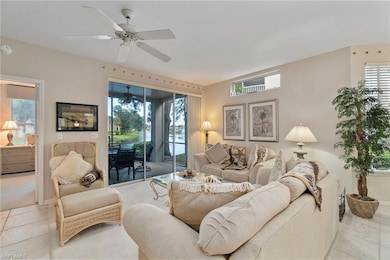
Escape to paradise at this beautifully furnished 3-bedroom, 2-bath ground-floor end-unit located in the highly sought-after Pelican Landing gated community in Estero. Thoughtfully designed and exquisitely decorated, this bright and airy residence accommodates up to six guests and offers the perfect blend of comfort, elegance, and Florida charm. THE SPACE: Step into an open-concept layout where the kitchen, dining, and living areas flow seamlessly together—ideal for gathering with family and friends. The fully equipped kitchen features all large and small appliances for your culinary needs, a large breakfast bar, and plenty of seating at both the counter and dining table. The end-unit location allows for abundant natural light throughout the home. Relax in the spacious great room with sliding doors leading to your private screened-in lanai, offering peaceful lake views—the perfect spot to enjoy your morning coffee or unwind with a glass of wine. The primary suite features a king bed, walk-in closet, and en-suite bath with walk-in shower. The first guest bedroom offers a queen bed, while the third bedroom doubles as a study with a desk and a pullout sofa. Each bedroom, along with the living room, includes a TV for your entertainment.
Additional amenities include Wifi, cable, washer and dryer, and a one-car garage. COMMUNITY AMENITIES: Guests enjoy full access to Pelican Landing’s incredible resort-style amenities, including: 34-acre private beach park on the Gulf of Mexico, 12 Har-Tru tennis courts & 6 pickleball courts
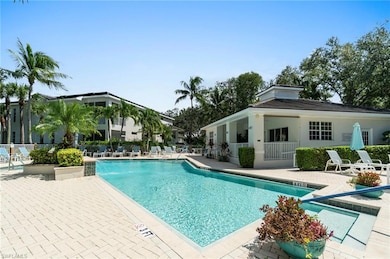
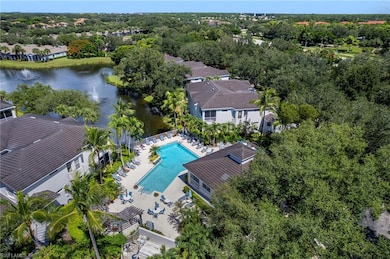
Bocce courts and state-of-the-art fitness center, Coconut Point Marina with complimentary kayaks, canoes, and sailing center, Walking and biking paths throughout the community, Heated pool, spa, and community room exclusive to The Pointe neighborhood.

Home Details
Home Type
- Single Family
Year Built
- Built in 1997
Lot Details
- 4,696 Sq Ft Lot
Parking
- 1 Car Attached Garage
Home Design
- Villa
Interior Spaces
- Property has 1 Level
- Ceiling Fan
- Lake Views
- Fire and Smoke Detector
Kitchen
- Cooktop
- Microwave
- Dishwasher
- Built-In or Custom Kitchen Cabinets
- Disposal
Flooring
- Carpet
- Tile
Bedrooms and Bathrooms
- 3 Bedrooms
- Walk-In Closet
- 2 Full Bathrooms
Laundry
- Laundry in unit
- Dryer
- Washer
Outdoor Features
- Beach Access
- Basketball Court
Utilities
- Central Air
- Heating Available
- Cable TV Available
Listing and Financial Details
- No Smoking Allowed
- Assessor Parcel Number 21-47-25-B3-0300I.1020
- Tax Block 300I
Community Details
Overview
- 1,622 Sq Ft Building
- Pointe At Pelican Landing Subdivision
Amenities
- Community Barbecue Grill
- Clubhouse
Recreation
- Beach Club Membership Available
- Tennis Courts
- Pickleball Courts
- Bocce Ball Court
- Fitness Center
- Community Pool
- Community Spa
- Bike Trail
Pet Policy
- No Pets Allowed
Security
- Gated Community
Map
Property History
| Date | Event | Price | List to Sale | Price per Sq Ft |
|---|---|---|---|---|
| 11/05/2025 11/05/25 | For Rent | $6,250 | -- | -- |
Source: Naples Area Board of REALTORS®
MLS Number: 225078320
APN: 21-47-25-B3-0300I.1020
Disclaimer: Certain information contained herein is derived from information provided by parties other than Homes.com. All information provided is deemed reliable, but is not guaranteed to be accurate and should be independently verified.
![]() The source of this real property information is the copyrighted and proprietary database compilation of the M.L.S. of Naples, Inc. Copyright 2025 M.L.S. of Naples, Inc. All rights reserved. The accuracy of this information is not warranted or guaranteed. This information should be independently verified if any person intends to engage in a transaction in reliance upon it.
The source of this real property information is the copyrighted and proprietary database compilation of the M.L.S. of Naples, Inc. Copyright 2025 M.L.S. of Naples, Inc. All rights reserved. The accuracy of this information is not warranted or guaranteed. This information should be independently verified if any person intends to engage in a transaction in reliance upon it.
- 3421 Pointe Creek Ct Unit 101
- 3431 Pointe Creek Ct Unit 104
- 3461 Pointe Creek Ct Unit 204
- 3461 Pointe Creek Ct Unit 102
- 3466 Pointe Creek Ct Unit 201
- 3471 Pointe Creek Ct Unit 204
- 3471 Pointe Creek Ct Unit 201
- 8850 Springwood Ct
- 3400 Marbella Ct
- 0 S Tamiami Trail
- 8890 Springwood Ct
- 8851 Colonnades Ct W Unit 128
- 8851 Colonnades Ct W Unit 126
- 25350 Galashields Cir
- 8861 Colonnades Ct W Unit 215
- 25374 Galashields Cir
- 8870 Colonnades Ct W Unit 336
- 8870 Colonnades Ct W Unit 328
- 8960 Colonnades Ct E Unit 916
- 8960 Colonnades Ct E Unit 921
- 8850 Creek Run Dr
- 3416 Marbella Ct
- 8861 Colonnades Ct W Unit 215
- 8861 Colonnades Ct W Unit 216
- 25680 Springtide Ct
- 8870 Colonnades Ct W Unit 337
- 25240 Pelican Creek Cir Unit 202
- 8950 Colonnades Ct E Unit 824
- 25248 Pelican Creek Cir Unit 102
- 25232 Pelican Creek Cir Unit 202
- 25530 Springtide Ct
- 8940 Colonnades Ct E Unit 725
- 8930 Colonnades Ct E Unit 625
- 8930 Colonnades Ct E Unit 627
- 3400 Riviera Lakes Ct
- 3401 Tralee Ct Unit 202
- 26430 Coco Cay Cir Unit 203
- 9411 Cedar Creek Dr
- 9061 Isla Bella Cir
- 9385 Isla Bella Cir Unit ID1049687P