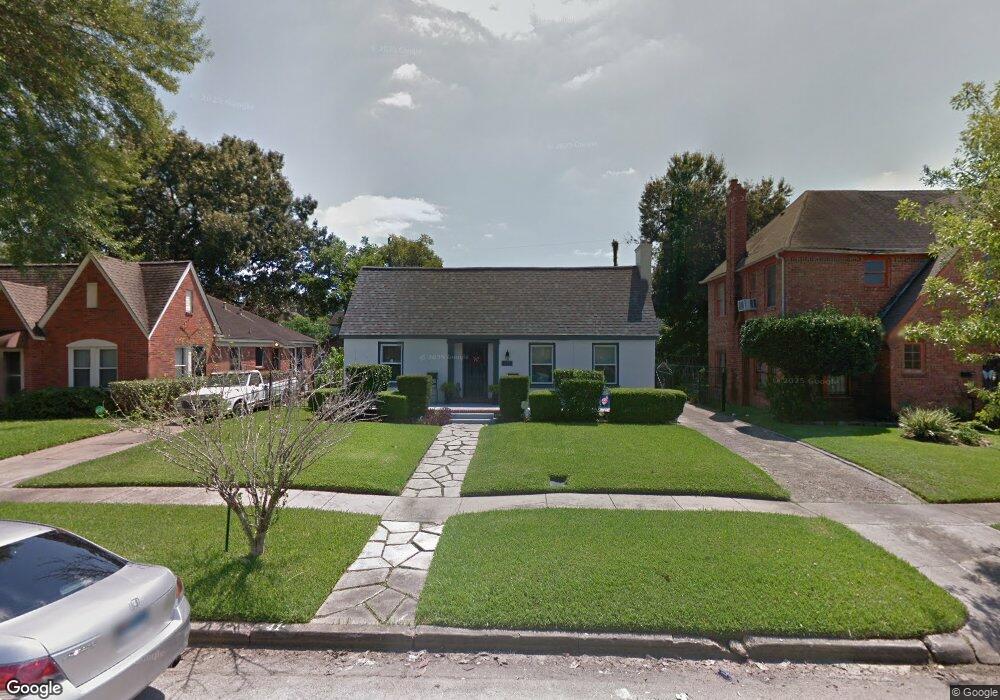
3412 Wichita St Houston, TX 77004
MacGregor NeighborhoodEstimated Value: $267,000 - $362,000
2
Beds
1
Bath
1,471
Sq Ft
$216/Sq Ft
Est. Value
About This Home
This home is located at 3412 Wichita St, Houston, TX 77004 and is currently estimated at $317,475, approximately $215 per square foot. 3412 Wichita St is a home located in Harris County with nearby schools including Lockhart Elementary School, Cullen Middle School, and Yates High School.
Ownership History
Date
Name
Owned For
Owner Type
Purchase Details
Closed on
Jul 8, 2004
Sold by
Johnson Lynetta
Bought by
Ware Christy M
Current Estimated Value
Home Financials for this Owner
Home Financials are based on the most recent Mortgage that was taken out on this home.
Original Mortgage
$149,350
Outstanding Balance
$75,052
Interest Rate
6.31%
Mortgage Type
Purchase Money Mortgage
Estimated Equity
$242,423
Purchase Details
Closed on
Jan 10, 2003
Sold by
Wallace Patricia Ann and Wallace Paul
Bought by
Johnson Lynetta
Home Financials for this Owner
Home Financials are based on the most recent Mortgage that was taken out on this home.
Original Mortgage
$117,000
Interest Rate
6%
Purchase Details
Closed on
Sep 11, 1994
Sold by
Trahan Laura P
Bought by
Wallace Patricia Ann
Create a Home Valuation Report for This Property
The Home Valuation Report is an in-depth analysis detailing your home's value as well as a comparison with similar homes in the area
Home Values in the Area
Average Home Value in this Area
Purchase History
| Date | Buyer | Sale Price | Title Company |
|---|---|---|---|
| Ware Christy M | -- | Alamo Title Company | |
| Johnson Lynetta | -- | Alamo Title Company | |
| Wallace Patricia Ann | -- | -- | |
| Thomas Horace N | -- | -- |
Source: Public Records
Mortgage History
| Date | Status | Borrower | Loan Amount |
|---|---|---|---|
| Open | Ware Christy M | $149,350 | |
| Previous Owner | Johnson Lynetta | $117,000 |
Source: Public Records
Tax History Compared to Growth
Tax History
| Year | Tax Paid | Tax Assessment Tax Assessment Total Assessment is a certain percentage of the fair market value that is determined by local assessors to be the total taxable value of land and additions on the property. | Land | Improvement |
|---|---|---|---|---|
| 2025 | $4,507 | $320,564 | $158,700 | $161,864 |
| 2024 | $4,507 | $320,564 | $158,700 | $161,864 |
| 2023 | $4,507 | $320,564 | $158,700 | $161,864 |
| 2022 | $6,828 | $350,000 | $158,700 | $191,300 |
| 2021 | $6,244 | $267,899 | $124,200 | $143,699 |
| 2020 | $7,058 | $278,238 | $124,200 | $154,038 |
| 2019 | $7,079 | $268,431 | $124,200 | $144,231 |
| 2018 | $4,647 | $268,431 | $124,200 | $144,231 |
| 2017 | $5,846 | $268,431 | $124,200 | $144,231 |
| 2016 | $5,315 | $226,038 | $117,300 | $108,738 |
| 2015 | $2,334 | $204,709 | $75,900 | $128,809 |
| 2014 | $2,334 | $121,598 | $75,900 | $45,698 |
Source: Public Records
Map
Nearby Homes
- 3420 Rosedale St
- 3418 Southmore Blvd
- 3338 Wichita St
- 3327 Palm St
- 3328 Southmore Blvd
- 3511 Arbor St
- 3411 Wentworth St
- 3439 Wentworth St
- 3410 Blodgett St
- 3312 Arbor St
- 3546 Rosedale St
- 3233 Rosedale St
- 5114 Grantwood St
- 3217 Calumet St
- 5121 Grantwood St
- 5108 Scott St
- 3562 Rosewood St
- 3118 Wentworth St
- 0 Southmore Blvd
- 3620 S Macgregor Way