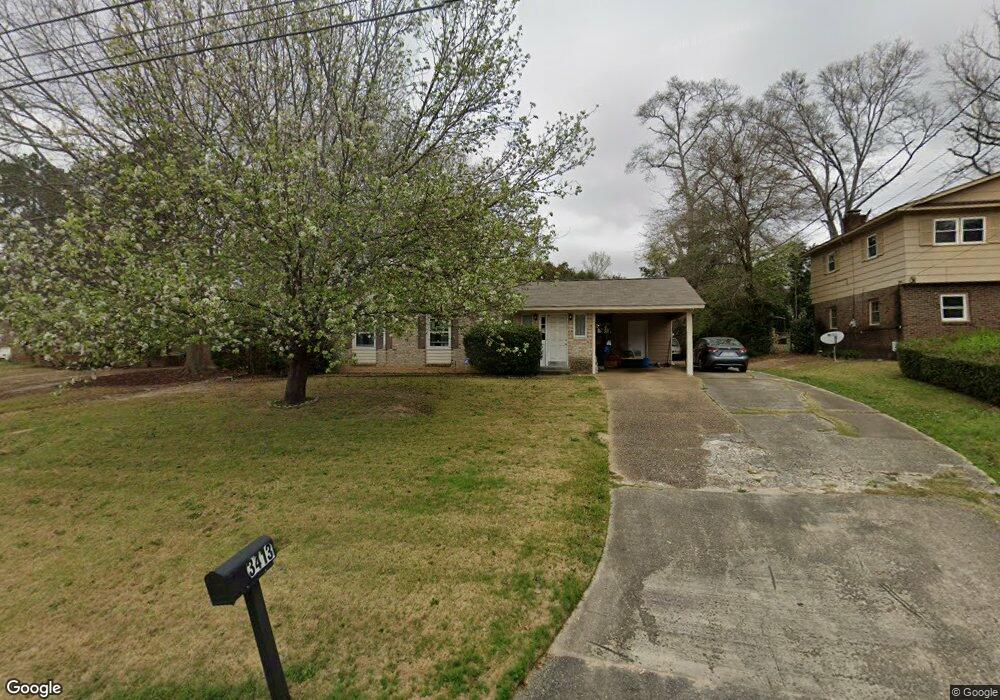
3413 Flint Dr Columbus, GA 31907
Eastern Columbus NeighborhoodEstimated Value: $238,000 - $254,000
3
Beds
2
Baths
1,820
Sq Ft
$135/Sq Ft
Est. Value
About This Home
This home is located at 3413 Flint Dr, Columbus, GA 31907 and is currently estimated at $245,462, approximately $134 per square foot. 3413 Flint Dr is a home located in Muscogee County with nearby schools including Clubview Elementary School, Richards Middle School, and Hardaway High School.
Ownership History
Date
Name
Owned For
Owner Type
Purchase Details
Closed on
Mar 14, 2018
Sold by
Federal Home Loan Mortgage Corporation
Bought by
Karabasz Laura
Current Estimated Value
Purchase Details
Closed on
Nov 8, 2017
Sold by
Wells Fargo Bank
Bought by
Federal Home Loan Mortgage Corporation
Purchase Details
Closed on
Nov 7, 2017
Sold by
Nobes Jennifer G
Bought by
Wells Fargo Bank Na
Purchase Details
Closed on
May 23, 2016
Bought by
Nobes Jennifer G
Purchase Details
Closed on
Mar 10, 2008
Sold by
Nobes Charles W and Nobes Jennifer G
Bought by
C&J Realprop Llc
Purchase Details
Closed on
Mar 2, 2007
Sold by
Nobes Charles W
Bought by
Nobes Jennifer G
Home Financials for this Owner
Home Financials are based on the most recent Mortgage that was taken out on this home.
Original Mortgage
$147,600
Interest Rate
6.27%
Mortgage Type
New Conventional
Create a Home Valuation Report for This Property
The Home Valuation Report is an in-depth analysis detailing your home's value as well as a comparison with similar homes in the area
Home Values in the Area
Average Home Value in this Area
Purchase History
| Date | Buyer | Sale Price | Title Company |
|---|---|---|---|
| Karabasz Laura | $76,000 | -- | |
| Federal Home Loan Mortgage Corporation | $82,827 | -- | |
| Wells Fargo Bank Na | $82,827 | -- | |
| Nobes Jennifer G | -- | -- | |
| C&J Realprop Llc | -- | None Available | |
| Nobes Jennifer G | -- | None Available |
Source: Public Records
Mortgage History
| Date | Status | Borrower | Loan Amount |
|---|---|---|---|
| Previous Owner | Nobes Jennifer G | $147,600 |
Source: Public Records
Tax History Compared to Growth
Tax History
| Year | Tax Paid | Tax Assessment Tax Assessment Total Assessment is a certain percentage of the fair market value that is determined by local assessors to be the total taxable value of land and additions on the property. | Land | Improvement |
|---|---|---|---|---|
| 2025 | $2,261 | $70,944 | $17,096 | $53,848 |
| 2024 | $2,260 | $70,944 | $17,096 | $53,848 |
| 2023 | $1,580 | $70,944 | $17,096 | $53,848 |
| 2022 | $2,536 | $62,120 | $17,096 | $45,024 |
| 2021 | $2,237 | $54,792 | $17,096 | $37,696 |
| 2020 | $695 | $54,792 | $17,096 | $37,696 |
| 2019 | $699 | $30,400 | $9,480 | $20,920 |
| 2018 | $2,397 | $58,504 | $17,096 | $41,408 |
| 2017 | $2,405 | $58,504 | $17,096 | $41,408 |
| 2016 | $2,308 | $55,940 | $9,128 | $46,812 |
| 2015 | $2,310 | $55,940 | $9,128 | $46,812 |
| 2014 | $2,344 | $56,675 | $9,128 | $47,547 |
| 2013 | -- | $56,675 | $9,128 | $47,547 |
Source: Public Records
Map
Nearby Homes
- 3716 University Ave
- 3409 Hiawatha Dr
- 3328 College Ave
- 3425 Tomahawk Dr
- 3337 Coweta Dr
- 3335 Junaluska Dr
- 3346 Junaluska Dr
- 3200 Tip Top Dr
- 3129 Avon Dr
- 3816 Anglin Rd
- 3604 Norris Rd
- 3834 Rockdale Dr
- 3409 Primrose Rd
- 3935 Dexter Dr
- 8 Primrose Ct
- 3224 Carden Dr
- 4419 Anglin Rd
- 3935 Tifton Dr
- 4004 Tifton Dr
- 4047 Sealy Ln