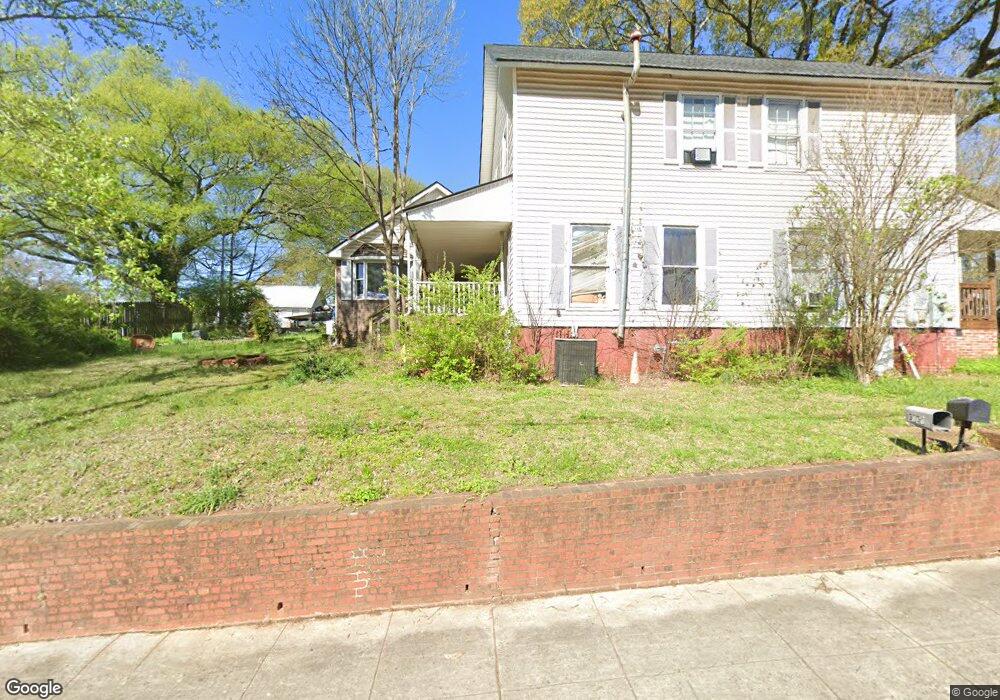
3414 Maple Rd SE Lindale, GA 30147
Estimated Value: $258,000 - $285,273
Studio
--
Bath
2,782
Sq Ft
$97/Sq Ft
Est. Value
About This Home
This home is located at 3414 Maple Rd SE, Lindale, GA 30147 and is currently estimated at $268,758, approximately $96 per square foot. 3414 Maple Rd SE is a home located in Floyd County with nearby schools including Pepperell Middle School, Pepperell High School, and Montessori School of Rome.
Ownership History
Date
Name
Owned For
Owner Type
Purchase Details
Closed on
Apr 8, 2022
Sold by
Falcon Mutual Llc
Bought by
Hoang Properties Llc
Current Estimated Value
Home Financials for this Owner
Home Financials are based on the most recent Mortgage that was taken out on this home.
Original Mortgage
$210,000
Interest Rate
3.76%
Mortgage Type
Mortgage Modification
Purchase Details
Closed on
Oct 12, 2018
Sold by
Bosarge Jane C
Bought by
A & J Properties Llc
Purchase Details
Closed on
Apr 20, 2011
Sold by
Lane Marjorie Tucker
Bought by
Bosarge Jane C
Purchase Details
Closed on
Dec 31, 2001
Sold by
Lane Thomas L and Borsarge Jane C
Bought by
Lane Marjorie Tucker
Purchase Details
Closed on
Oct 18, 2001
Sold by
Lane Marjorie Tucker
Bought by
Lane Thomas L and Borsarge Jane C
Purchase Details
Closed on
Dec 17, 1982
Sold by
Lane Tl
Bought by
Lane Marjorie Tucker
Purchase Details
Closed on
Jan 1, 1962
Sold by
Lane Ll
Bought by
Lane Tl
Purchase Details
Closed on
Jan 1, 1901
Bought by
Lane Ll
Create a Home Valuation Report for This Property
The Home Valuation Report is an in-depth analysis detailing your home's value as well as a comparison with similar homes in the area
Home Values in the Area
Average Home Value in this Area
Purchase History
| Date | Buyer | Sale Price | Title Company |
|---|---|---|---|
| Hoang Properties Llc | $184,000 | -- | |
| Falcon Mutual Llc | $174,000 | -- | |
| A & J Properties Llc | $60,000 | -- | |
| Bosarge Jane C | -- | -- | |
| Lane Marjorie Tucker | -- | -- | |
| Lane Thomas L | -- | -- | |
| Lane Marjorie Tucker | -- | -- | |
| Lane Tl | -- | -- | |
| Lane Ll | -- | -- |
Source: Public Records
Mortgage History
| Date | Status | Borrower | Loan Amount |
|---|---|---|---|
| Closed | Hoang Properties Llc | $210,000 |
Source: Public Records
Tax History
| Year | Tax Paid | Tax Assessment Tax Assessment Total Assessment is a certain percentage of the fair market value that is determined by local assessors to be the total taxable value of land and additions on the property. | Land | Improvement |
|---|---|---|---|---|
| 2025 | $3,502 | $119,614 | $10,424 | $109,190 |
| 2024 | $3,502 | $106,213 | $9,477 | $96,736 |
| 2023 | $3,115 | $111,838 | $8,615 | $103,223 |
| 2022 | $1,731 | $55,723 | $6,892 | $48,831 |
| 2021 | $1,271 | $39,627 | $6,892 | $32,735 |
| 2020 | $1,194 | $36,894 | $5,169 | $31,725 |
| 2019 | $787 | $35,776 | $5,169 | $30,607 |
| 2018 | $1,141 | $35,807 | $5,169 | $30,638 |
| 2017 | $1,128 | $35,294 | $5,169 | $30,125 |
| 2016 | $1,461 | $45,730 | $5,160 | $40,570 |
| 2015 | -- | $45,730 | $5,160 | $40,570 |
| 2014 | -- | $45,730 | $5,160 | $40,570 |
Source: Public Records
Map
Nearby Homes
- 0 2nd St- Lindale Ave
- 6 Hillside Ave SE
- 106 Sunset Dr SE
- 16 Summit Dr SE
- 10 N Hillcrest Dr SE
- 17 N Terrace Ave SE
- 13 Spring Cir SE
- 280 Ravenwood Dr SE
- 305 Grove Ave SE
- 311 Park Ave SE
- 0 Edenfield Dr SE Unit 21222627
- 317 Garden Ave SE
- 211 Hooper Ave SE
- 302 Jack St
- 206 Hooper Ave SE
- 206C Hooper Ave SE
- 208 Hooper Ave SE
- 0 Club View Dr SE Unit 10707184
- 0 Club View Dr SE Unit 7732546
- 169 Jack St SE
- 3408 Maple Rd SE
- 3418 Maple Rd SE
- 109 Avenue C SE
- 3415 Maple Rd SE
- 3406 Maple Rd SE
- 3404 Maple Rd SE
- 3420 Maple Rd SE
- 3419 Maple St SE
- 121 Avenue C SE
- 114 Avenue C SE
- 118 Avenue C SE
- 114 Avenue A SE Unit 116
- 114 Avenue A SE Unit A
- 114 Avenue A SE
- 112 Avenue C SE
- 3402 Maple Rd SE
- 0 Park Ave SE Unit 8215248
- 0 Park Ave SE Unit 7083265
- 0 Park Ave SE Unit 7075834
- 3424 Maple Rd SE
Your Personal Tour Guide
Ask me questions while you tour the home.