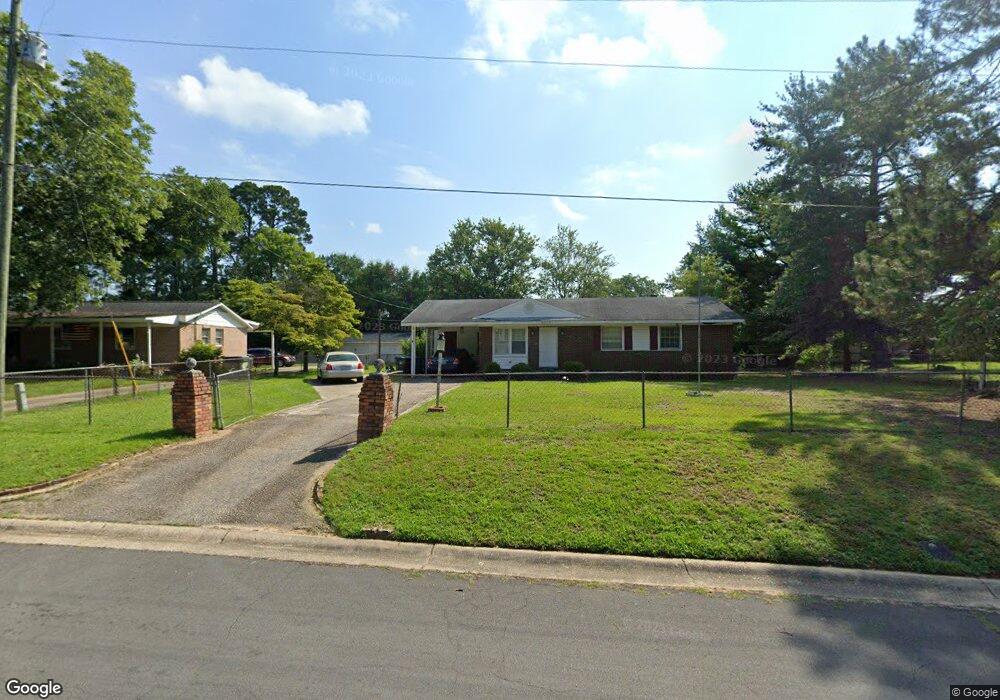
3414 McChoen Dr Fayetteville, NC 28311
Lake Pines NeighborhoodEstimated Value: $167,000 - $202,000
3
Beds
2
Baths
1,150
Sq Ft
$156/Sq Ft
Est. Value
About This Home
This home is located at 3414 McChoen Dr, Fayetteville, NC 28311 and is currently estimated at $179,150, approximately $155 per square foot. 3414 McChoen Dr is a home located in Cumberland County with nearby schools including Westarea Elementary School, Luther Nick Jeralds Middle School, and E. E. Smith High School.
Ownership History
Date
Name
Owned For
Owner Type
Purchase Details
Closed on
Jun 6, 2013
Sold by
Ingle Sub Tr Grady I and Rayner Michael M
Bought by
Bulldog Real Estate Llc
Current Estimated Value
Purchase Details
Closed on
Nov 14, 2008
Sold by
Us Bank National Asoc
Bought by
Rayner Michael M
Home Financials for this Owner
Home Financials are based on the most recent Mortgage that was taken out on this home.
Original Mortgage
$75,010
Interest Rate
6.01%
Mortgage Type
FHA
Purchase Details
Closed on
Sep 9, 2008
Sold by
Grady I Ingle Sub Tr
Bought by
Us Bank National
Purchase Details
Closed on
Jan 12, 2006
Sold by
Chase Home Finance L L C
Bought by
Mcneill James A
Home Financials for this Owner
Home Financials are based on the most recent Mortgage that was taken out on this home.
Original Mortgage
$39,200
Interest Rate
10.39%
Mortgage Type
Adjustable Rate Mortgage/ARM
Create a Home Valuation Report for This Property
The Home Valuation Report is an in-depth analysis detailing your home's value as well as a comparison with similar homes in the area
Home Values in the Area
Average Home Value in this Area
Purchase History
| Date | Buyer | Sale Price | Title Company |
|---|---|---|---|
| Bulldog Real Estate Llc | $36,288 | -- | |
| Rayner Michael M | $76,000 | -- | |
| Us Bank National | $84,000 | -- | |
| Mcneill James A | $56,000 | -- |
Source: Public Records
Mortgage History
| Date | Status | Borrower | Loan Amount |
|---|---|---|---|
| Previous Owner | Rayner Michael M | $75,010 | |
| Previous Owner | Mcneill James A | $39,200 | |
| Previous Owner | Mcneill James A | $39,200 |
Source: Public Records
Tax History Compared to Growth
Tax History
| Year | Tax Paid | Tax Assessment Tax Assessment Total Assessment is a certain percentage of the fair market value that is determined by local assessors to be the total taxable value of land and additions on the property. | Land | Improvement |
|---|---|---|---|---|
| 2024 | $2,381 | $98,584 | $17,000 | $81,584 |
| 2023 | $1,817 | $98,584 | $17,000 | $81,584 |
| 2022 | $1,603 | $98,584 | $17,000 | $81,584 |
| 2021 | $1,603 | $98,584 | $17,000 | $81,584 |
| 2019 | $1,568 | $96,300 | $17,000 | $79,300 |
| 2018 | $1,568 | $96,300 | $17,000 | $79,300 |
| 2017 | $1,465 | $96,300 | $17,000 | $79,300 |
| 2016 | $1,291 | $93,100 | $17,000 | $76,100 |
| 2015 | $1,278 | $93,100 | $17,000 | $76,100 |
| 2014 | $1,271 | $93,100 | $17,000 | $76,100 |
Source: Public Records
Map
Nearby Homes