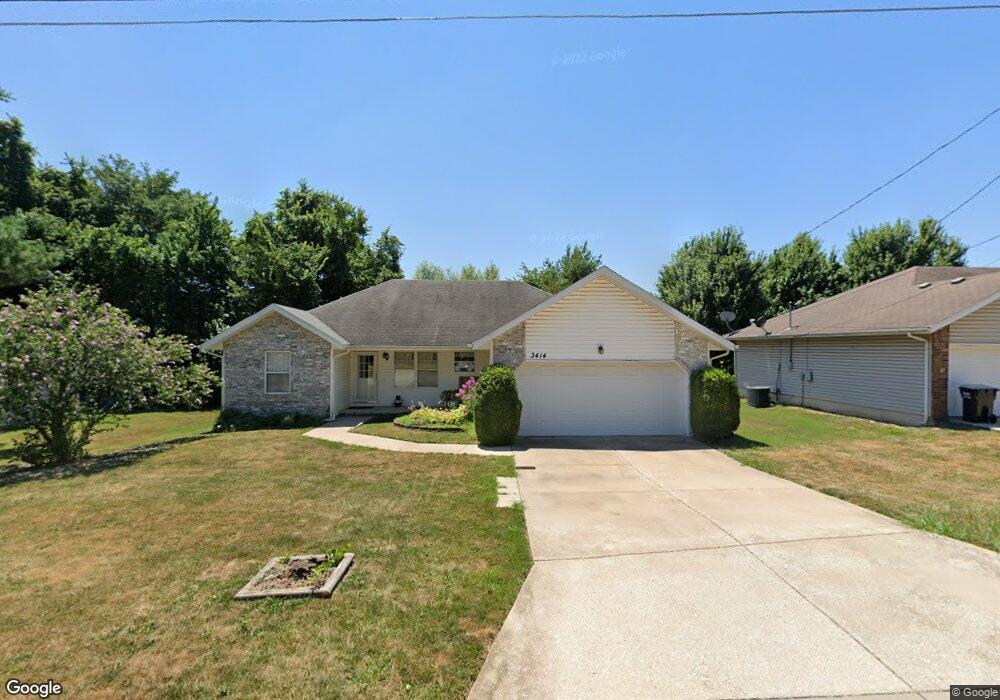
3414 W Riverside St Springfield, MO 65807
Southwest Springfield NeighborhoodEstimated Value: $216,000 - $230,000
3
Beds
2
Baths
1,302
Sq Ft
$173/Sq Ft
Est. Value
About This Home
This home is located at 3414 W Riverside St, Springfield, MO 65807 and is currently estimated at $224,617, approximately $172 per square foot. 3414 W Riverside St is a home located in Greene County with nearby schools including Jeffries Elementary School, Carver Middle School, and Kickapoo High School.
Ownership History
Date
Name
Owned For
Owner Type
Purchase Details
Closed on
Aug 30, 2016
Sold by
Stiles Scott Alan and Stiles Nicole A
Bought by
Stiles Homes Llc
Current Estimated Value
Purchase Details
Closed on
Mar 20, 2009
Sold by
Stiles Scott A and Stiles Nicole A
Bought by
Stiles Ii Scott A and Stiles Nicole A
Home Financials for this Owner
Home Financials are based on the most recent Mortgage that was taken out on this home.
Original Mortgage
$108,924
Outstanding Balance
$69,257
Interest Rate
5.21%
Mortgage Type
Purchase Money Mortgage
Estimated Equity
$155,360
Purchase Details
Closed on
Jul 31, 2007
Sold by
Harrison Russell E and Harrison Sharon S
Bought by
Stiles Ii Scott A
Home Financials for this Owner
Home Financials are based on the most recent Mortgage that was taken out on this home.
Original Mortgage
$107,315
Interest Rate
6.73%
Mortgage Type
FHA
Create a Home Valuation Report for This Property
The Home Valuation Report is an in-depth analysis detailing your home's value as well as a comparison with similar homes in the area
Home Values in the Area
Average Home Value in this Area
Purchase History
| Date | Buyer | Sale Price | Title Company |
|---|---|---|---|
| Stiles Homes Llc | -- | None Available | |
| Stiles Ii Scott A | -- | Choice Escrow&Land Title Llc | |
| Stiles Ii Scott A | -- | Fidelity Title Agency |
Source: Public Records
Mortgage History
| Date | Status | Borrower | Loan Amount |
|---|---|---|---|
| Open | Stiles Ii Scott A | $108,924 | |
| Closed | Stiles Ii Scott A | $107,315 |
Source: Public Records
Tax History
| Year | Tax Paid | Tax Assessment Tax Assessment Total Assessment is a certain percentage of the fair market value that is determined by local assessors to be the total taxable value of land and additions on the property. | Land | Improvement |
|---|---|---|---|---|
| 2025 | $1,611 | $31,260 | $7,410 | $23,850 |
| 2024 | $1,475 | $26,640 | $4,750 | $21,890 |
| 2023 | $1,468 | $26,640 | $4,750 | $21,890 |
| 2022 | $1,253 | $23,310 | $4,750 | $18,560 |
| 2021 | $1,252 | $23,310 | $4,750 | $18,560 |
| 2020 | $1,112 | $19,630 | $4,750 | $14,880 |
| 2019 | $1,080 | $19,630 | $4,750 | $14,880 |
| 2018 | $1,055 | $19,130 | $4,750 | $14,380 |
| 2017 | $1,045 | $18,340 | $4,750 | $13,590 |
| 2016 | $1,002 | $18,340 | $4,750 | $13,590 |
| 2015 | $994 | $18,340 | $4,750 | $13,590 |
| 2014 | $995 | $18,200 | $4,750 | $13,450 |
Source: Public Records
Map
Nearby Homes
- 3878 S Leawood Ave
- 3866 S Leawood Ave
- 4104 S Meadowlark Dr
- 3669 S Ridgecrest Ave
- 3651 S Sunrise Ave
- 3371 W Primrose St
- 3398 W Roxbury St
- 4261 S Meadowlark Dr
- 3223 W Primrose St
- 3710 W Sylvania St
- 4321 S Ridgecrest Dr
- 3808 W Kingsley St
- 3494 S Leawood Ave
- 3831 S Walnut Hill Ave
- 3748 S Hillcrest Ave
- 3464 S Lexus Ave
- 3455 S Doris Ave
- 3569 W Cardinal Dr
- 3692 W Overland St
- 3707 S Swan Ct
- 3422 W Riverside St
- 3404 W Riverside St
- 3415 W Riverside St
- 3358 W Riverside St
- 3430 W Riverside St
- 3405 W Riverside St
- 3425 W Riverside St
- 3435 W Riverside St
- 3359 W Riverside St
- 3879 S Sunrise Ave
- 3430 W Highland Place
- 3350 W Riverside St
- 3880 S Sunrise Ave
- 3436 W Highland Place
- 3428 W Highland Place
- 3873 S Beechwood Ave
- 3872 S Leawood Ave
- 3867 S Sunrise Ave
- 3865 S Beechwood Ave
- 3868 S Sunrise Ave
Your Personal Tour Guide
Ask me questions while you tour the home.