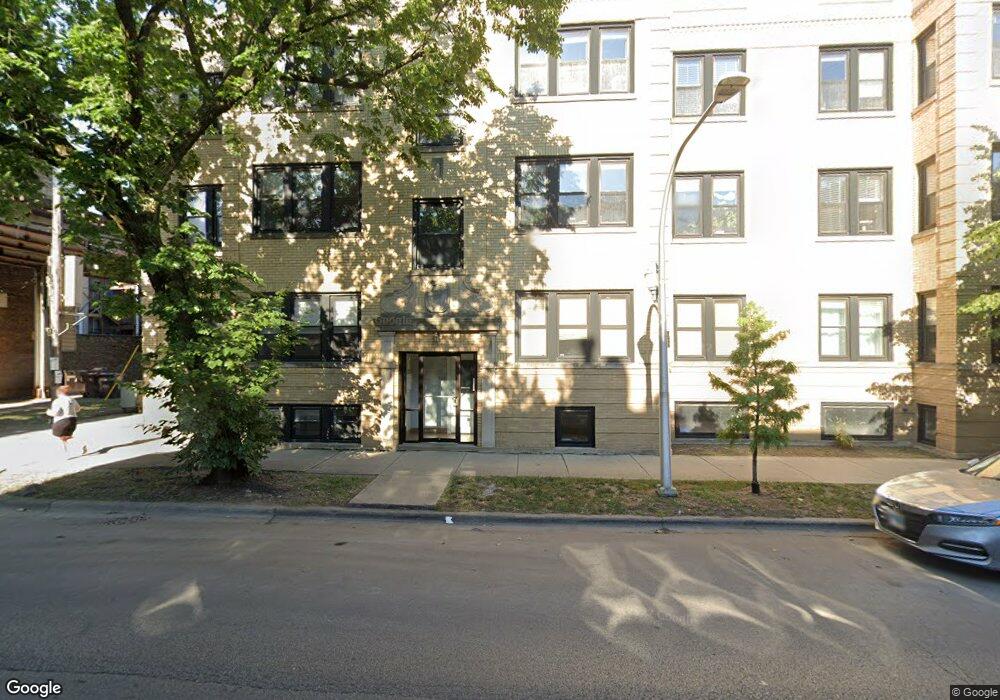
3416 N Racine Ave Unit 34163 Chicago, IL 60657
Lakeview NeighborhoodEstimated Value: $384,552 - $462,000
2
Beds
2
Baths
15,292
Sq Ft
$27/Sq Ft
Est. Value
About This Home
This home is located at 3416 N Racine Ave Unit 34163, Chicago, IL 60657 and is currently estimated at $409,638, approximately $26 per square foot. 3416 N Racine Ave Unit 34163 is a home located in Cook County with nearby schools including Hamilton Elementary School, Lake View High School, and Saint Luke Academy.
Ownership History
Date
Name
Owned For
Owner Type
Purchase Details
Closed on
May 14, 2018
Sold by
Jcq Llc
Bought by
Dikeman Kurt
Current Estimated Value
Home Financials for this Owner
Home Financials are based on the most recent Mortgage that was taken out on this home.
Original Mortgage
$292,500
Outstanding Balance
$253,116
Interest Rate
4.62%
Mortgage Type
New Conventional
Estimated Equity
$156,522
Purchase Details
Closed on
Apr 14, 2014
Sold by
Sipple Jeffrey M
Bought by
Jcq Llc
Purchase Details
Closed on
Jul 23, 2007
Sold by
3414 N Racine Llc
Bought by
Sipple Jeffrey M
Home Financials for this Owner
Home Financials are based on the most recent Mortgage that was taken out on this home.
Original Mortgage
$271,920
Interest Rate
6.62%
Mortgage Type
Purchase Money Mortgage
Create a Home Valuation Report for This Property
The Home Valuation Report is an in-depth analysis detailing your home's value as well as a comparison with similar homes in the area
Home Values in the Area
Average Home Value in this Area
Purchase History
| Date | Buyer | Sale Price | Title Company |
|---|---|---|---|
| Dikeman Kurt | $325,000 | Chicago Title | |
| Jcq Llc | -- | None Available | |
| Sipple Jeffrey M | $340,000 | None Available |
Source: Public Records
Mortgage History
| Date | Status | Borrower | Loan Amount |
|---|---|---|---|
| Open | Dikeman Kurt | $292,500 | |
| Previous Owner | Sipple Jeffrey M | $271,920 |
Source: Public Records
Tax History Compared to Growth
Tax History
| Year | Tax Paid | Tax Assessment Tax Assessment Total Assessment is a certain percentage of the fair market value that is determined by local assessors to be the total taxable value of land and additions on the property. | Land | Improvement |
|---|---|---|---|---|
| 2024 | $5,907 | $33,581 | $11,174 | $22,407 |
| 2023 | $5,759 | $28,000 | $9,011 | $18,989 |
| 2022 | $5,759 | $28,000 | $9,011 | $18,989 |
| 2021 | $5,630 | $27,999 | $9,010 | $18,989 |
| 2020 | $5,794 | $26,008 | $3,844 | $22,164 |
| 2019 | $5,692 | $28,331 | $3,844 | $24,487 |
| 2018 | $4,918 | $28,331 | $3,844 | $24,487 |
| 2017 | $4,841 | $25,862 | $3,364 | $22,498 |
| 2016 | $4,680 | $25,862 | $3,364 | $22,498 |
| 2015 | $4,258 | $25,862 | $3,364 | $22,498 |
| 2014 | $3,961 | $23,918 | $2,748 | $21,170 |
| 2013 | $3,872 | $23,918 | $2,748 | $21,170 |
Source: Public Records
Map
Nearby Homes
- 1140 W Newport Ave Unit H
- 3335 N Racine Ave Unit 3335F
- 1142 W Cornelia Ave Unit 3
- 1150 W School St Unit 1150
- 3351 N Seminary Ave Unit 3S
- 1327 W Roscoe St Unit 2
- 3325 N Seminary Ave Unit 1N
- 1123 W Addison St
- 1014 W Roscoe St Unit 1F
- 1014 W Roscoe St Unit OP-
- 1134 W Addison St
- 1124 W Addison St Unit 1
- 1124 W Addison St Unit 2
- 3434 N Southport Ave Unit 2
- 3539 N Southport Ave Unit 2N
- 3223 N Seminary Ave Unit 3
- 3335 N Sheffield Ave
- 3509 N Janssen Ave
- 3519 N Sheffield Ave Unit 2N
- 1316 W Belmont Ave Unit 2E
- 3416 N Racine Ave Unit 3
- 3416 N Racine Ave Unit 34162
- 3416 N Racine Ave Unit 34161
- 3416 N Racine Ave Unit 1
- 3416 N Racine Ave Unit 2
- 3414 N Racine Ave Unit 3
- 3414 N Racine Ave Unit 34141
- 3414 N Racine Ave Unit 34143
- 3414 N Racine Ave Unit 34142
- 3414 N Racine Ave Unit 3
- 3414 N Racine Ave Unit 1
- 3422 N Racine Ave Unit 2
- 3422 N Racine Ave Unit 34221
- 3422 N Racine Ave Unit 34222
- 3422 N Racine Ave Unit 34223
- 3422 N Racine Ave Unit 1
- 3422 N Racine Ave Unit 3
- 3424 N Racine Ave Unit P3
- 3424 N Racine Ave Unit P2
- 3424 N Racine Ave Unit 34243