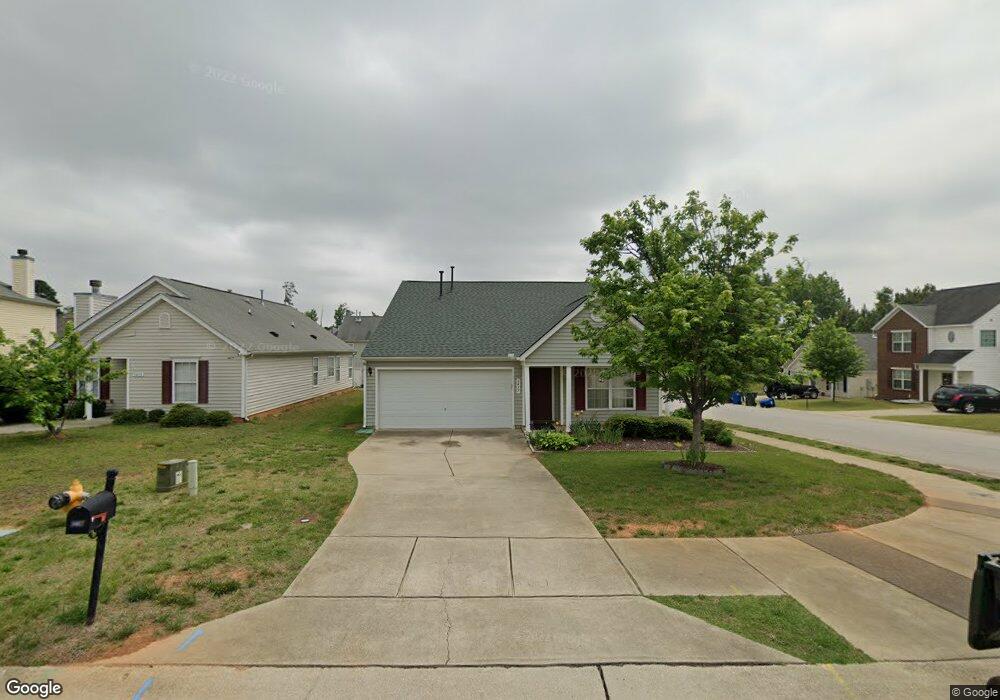
3417 Fatima Ct Raleigh, NC 27610
South Raleigh NeighborhoodEstimated Value: $320,000 - $328,000
3
Beds
2
Baths
1,530
Sq Ft
$212/Sq Ft
Est. Value
About This Home
This home is located at 3417 Fatima Ct, Raleigh, NC 27610 and is currently estimated at $323,682, approximately $211 per square foot. 3417 Fatima Ct is a home located in Wake County with nearby schools including Rand Road Elementary, North Garner Middle, and Middle Creek High.
Ownership History
Date
Name
Owned For
Owner Type
Purchase Details
Closed on
Dec 4, 2007
Sold by
Hayes Mark E and Hayes Rebecca R
Bought by
Solorio Carlos A and Hernandez Blanca E
Current Estimated Value
Home Financials for this Owner
Home Financials are based on the most recent Mortgage that was taken out on this home.
Original Mortgage
$144,900
Outstanding Balance
$92,000
Interest Rate
6.36%
Mortgage Type
Purchase Money Mortgage
Estimated Equity
$231,682
Purchase Details
Closed on
Apr 23, 2007
Sold by
Open Door Properties Llc
Bought by
Hayes Mark
Purchase Details
Closed on
Oct 19, 2006
Sold by
Fogg Larry Donnell
Bought by
Evans Shirley Mae
Purchase Details
Closed on
May 31, 2005
Sold by
Homelife Communities Of Raleigh Inc
Bought by
Fogg Larry D and Evans Shirley
Home Financials for this Owner
Home Financials are based on the most recent Mortgage that was taken out on this home.
Original Mortgage
$29,800
Interest Rate
5.35%
Mortgage Type
Stand Alone Second
Create a Home Valuation Report for This Property
The Home Valuation Report is an in-depth analysis detailing your home's value as well as a comparison with similar homes in the area
Home Values in the Area
Average Home Value in this Area
Purchase History
| Date | Buyer | Sale Price | Title Company |
|---|---|---|---|
| Solorio Carlos A | $145,000 | None Available | |
| Hayes Mark | $123,000 | None Available | |
| Open Door Properties Llc | $118,500 | None Available | |
| Evans Shirley Mae | -- | None Available | |
| Fogg Larry D | $150,000 | -- |
Source: Public Records
Mortgage History
| Date | Status | Borrower | Loan Amount |
|---|---|---|---|
| Open | Solorio Carlos A | $144,900 | |
| Previous Owner | Fogg Larry D | $29,800 | |
| Previous Owner | Fogg Larry D | $119,650 |
Source: Public Records
Tax History Compared to Growth
Tax History
| Year | Tax Paid | Tax Assessment Tax Assessment Total Assessment is a certain percentage of the fair market value that is determined by local assessors to be the total taxable value of land and additions on the property. | Land | Improvement |
|---|---|---|---|---|
| 2025 | $2,900 | $330,263 | $90,000 | $240,263 |
| 2024 | $2,888 | $330,263 | $90,000 | $240,263 |
| 2023 | $2,261 | $205,601 | $40,000 | $165,601 |
| 2022 | $2,102 | $205,601 | $40,000 | $165,601 |
| 2021 | $2,021 | $205,601 | $40,000 | $165,601 |
| 2020 | $1,984 | $205,601 | $40,000 | $165,601 |
| 2019 | $1,648 | $140,473 | $20,000 | $120,473 |
| 2018 | $1,555 | $140,473 | $20,000 | $120,473 |
| 2017 | $1,481 | $140,473 | $20,000 | $120,473 |
| 2016 | $1,451 | $140,473 | $20,000 | $120,473 |
| 2015 | $1,677 | $160,016 | $32,000 | $128,016 |
| 2014 | $1,591 | $160,016 | $32,000 | $128,016 |
Source: Public Records
Map
Nearby Homes
- 3221 Snowberry Dr
- 3305 Paschall Ct
- 1445 Lombar St
- 3405 Mogollon Ct
- 3620 Waleback Ln
- 3204 Winfield Ct
- 3208 Tradewind Ct
- 1416 Oakhill Ct
- 123 Alta Crest Ln
- 1725 Fox Hollow Dr
- 1200 Armstrong Cir
- 2801 Quince Dr
- 3708 Woodside Rd
- 2809 Newark Dr
- 2200 Sanderford Rd
- 1600 Cranston Rd
- 1606 Cranston Rd
- 3060 Camden Creek Dr
- 3755 Burtons Barn St
- 913 Skinner Dr
- 3413 Fatima Ct
- 3416 Rocket Ct
- 3409 Fatima Ct
- 3412 Rocket Ct
- 1408 Ricochet Dr
- 1404 Ricochet Dr
- 1400 Ricochet Dr
- 1412 Ricochet Dr
- 3408 Rocket Ct
- 3416 Fatima Ct
- 3405 Fatima Ct
- 1334 Ricochet Dr
- 3412 Fatima Ct
- 3400 Fatima Ct
- 3404 Rocket Ct
- 1330 Ricochet Dr
- 3408 Fatima Ct
- 1420 Ricochet Dr
- 3404 Fatima Ct
- 1341 Ujamaa Dr