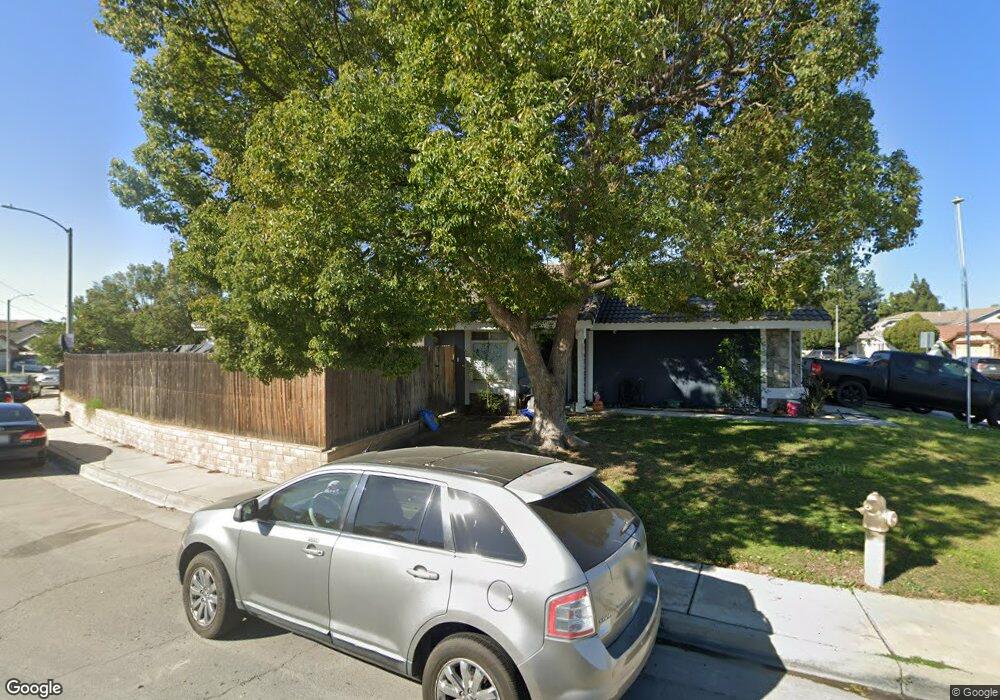
3418 Sugar Maple Ct Ontario, CA 91761
Ontario Ranch NeighborhoodEstimated Value: $587,000 - $662,000
3
Beds
2
Baths
1,070
Sq Ft
$580/Sq Ft
Est. Value
About This Home
This home is located at 3418 Sugar Maple Ct, Ontario, CA 91761 and is currently estimated at $620,925, approximately $580 per square foot. 3418 Sugar Maple Ct is a home located in San Bernardino County with nearby schools including Creek View Elementary School, Grace Yokley Middle School, and Colony High.
Ownership History
Date
Name
Owned For
Owner Type
Purchase Details
Closed on
Apr 1, 2008
Sold by
Us Bank Na
Bought by
Osuna Adam John and Osuna Amanda Breann
Current Estimated Value
Home Financials for this Owner
Home Financials are based on the most recent Mortgage that was taken out on this home.
Original Mortgage
$286,000
Outstanding Balance
$179,557
Interest Rate
5.8%
Mortgage Type
VA
Estimated Equity
$441,368
Purchase Details
Closed on
Jul 12, 2007
Sold by
Campas Ruben
Bought by
Us Bank Na and Structured Asset Securities Corp Mortgag
Purchase Details
Closed on
Jan 11, 2006
Sold by
Patel Saryubala S
Bought by
Campas Ruben and Campas Denise
Home Financials for this Owner
Home Financials are based on the most recent Mortgage that was taken out on this home.
Original Mortgage
$300,000
Interest Rate
8.87%
Mortgage Type
Purchase Money Mortgage
Purchase Details
Closed on
Jul 7, 2005
Sold by
Patel Subashbhai Jethabhyai
Bought by
Patel Saryubala S
Home Financials for this Owner
Home Financials are based on the most recent Mortgage that was taken out on this home.
Original Mortgage
$328,500
Interest Rate
8.45%
Mortgage Type
Fannie Mae Freddie Mac
Purchase Details
Closed on
Dec 5, 2003
Sold by
Patel Saryubala S
Bought by
Lozano Epifanio
Home Financials for this Owner
Home Financials are based on the most recent Mortgage that was taken out on this home.
Original Mortgage
$232,000
Interest Rate
5.92%
Mortgage Type
Purchase Money Mortgage
Purchase Details
Closed on
Jul 28, 2003
Sold by
Patel Subashbal Jethabhai
Bought by
Patel Saryubala S
Home Financials for this Owner
Home Financials are based on the most recent Mortgage that was taken out on this home.
Original Mortgage
$171,000
Interest Rate
8.3%
Mortgage Type
Purchase Money Mortgage
Purchase Details
Closed on
Jul 1, 2003
Sold by
Campas Ruben C
Bought by
Patel Saryubala S
Home Financials for this Owner
Home Financials are based on the most recent Mortgage that was taken out on this home.
Original Mortgage
$171,000
Interest Rate
8.3%
Mortgage Type
Purchase Money Mortgage
Purchase Details
Closed on
Mar 30, 1994
Sold by
Fralick Lance A
Bought by
Campas Ruben C and Campas Denise R
Home Financials for this Owner
Home Financials are based on the most recent Mortgage that was taken out on this home.
Original Mortgage
$103,783
Interest Rate
8.56%
Mortgage Type
FHA
Create a Home Valuation Report for This Property
The Home Valuation Report is an in-depth analysis detailing your home's value as well as a comparison with similar homes in the area
Home Values in the Area
Average Home Value in this Area
Purchase History
| Date | Buyer | Sale Price | Title Company |
|---|---|---|---|
| Osuna Adam John | $280,000 | First American Title Ins Co | |
| Us Bank Na | $324,444 | Accommodation | |
| Campas Ruben | $375,000 | Investors Title Co San Bern | |
| Patel Saryubala S | -- | Investors Title Co San Bern | |
| Patel Saryubala S | -- | Investors Title Co San Bern | |
| Lozano Epifanio | $232,000 | Investors Title Co San Bern | |
| Lozano Epifanio | -- | Investors Title Co San Bern | |
| Patel Saryubala S | -- | Investors Title Company | |
| Patel Saryubala S | $190,000 | Investors Title Company | |
| Campas Ruben C | $124,000 | Old Republic Title Company |
Source: Public Records
Mortgage History
| Date | Status | Borrower | Loan Amount |
|---|---|---|---|
| Open | Osuna Adam John | $286,000 | |
| Previous Owner | Campas Ruben | $300,000 | |
| Previous Owner | Patel Saryubala S | $328,500 | |
| Previous Owner | Lozano Epifanio | $232,000 | |
| Previous Owner | Patel Saryubala S | $171,000 | |
| Previous Owner | Campas Ruben C | $103,783 | |
| Closed | Patel Saryubala S | $9,500 |
Source: Public Records
Tax History
| Year | Tax Paid | Tax Assessment Tax Assessment Total Assessment is a certain percentage of the fair market value that is determined by local assessors to be the total taxable value of land and additions on the property. | Land | Improvement |
|---|---|---|---|---|
| 2025 | $3,916 | $367,785 | $128,725 | $239,060 |
| 2024 | $3,811 | $360,574 | $126,201 | $234,373 |
| 2023 | $3,724 | $353,503 | $123,726 | $229,777 |
| 2022 | $3,657 | $346,572 | $121,300 | $225,272 |
| 2021 | $3,625 | $339,777 | $118,922 | $220,855 |
| 2020 | $3,560 | $336,293 | $117,703 | $218,590 |
| 2019 | $3,541 | $329,699 | $115,395 | $214,304 |
| 2018 | $3,452 | $323,234 | $113,132 | $210,102 |
| 2017 | $3,325 | $316,896 | $110,914 | $205,982 |
| 2016 | $3,390 | $310,682 | $108,739 | $201,943 |
| 2015 | $3,375 | $306,016 | $107,106 | $198,910 |
| 2014 | $3,174 | $280,000 | $98,000 | $182,000 |
Source: Public Records
Map
Nearby Homes
- 2633 Tahoe Dr
- 3242 Antler Rd
- 3918 E Cambria Privado
- 2727 Eagle Creek Place
- 2813 Tuolumne Place Unit F
- 2714 Blue Fox Dr
- 3627 Oak Creek Dr Unit F
- 2804 Rippling Brook Place
- 3635 Oak Creek Dr
- 2622 Silverado Creek Place
- 3817 Antelope Creek Dr
- 2845 E Berry Loop Unit 33
- 3736 Oak Creek Dr
- 3043 E Merion St
- 3718 Strawberry Creek Way
- 3424 E Moonstone Dr
- 3443 E Moonstone Dr
- 2750 E Oak Hill Dr Unit 16
- 3230 S Agate Paseo
- 3246 S Agate Paseo
- 3414 Sugar Maple Ct
- 3412 Sugar Maple Ct
- 3411 Evergreen Dr
- 3410 Sugar Maple Ct
- 3426 Evergreen Dr
- 3424 Evergreen Dr
- 3422 Evergreen Dr
- 3428 Evergreen Dr
- 3419 Sugar Maple Ct
- 3417 Sugar Maple Ct
- 3430 Evergreen Dr
- 3420 Evergreen Dr
- 3409 Evergreen Dr
- 3408 Sugar Maple Ct
- 3415 Sugar Maple Ct
- 3418 Evergreen Dr
- 3416 Evergreen Dr
- 3432 Evergreen Dr
- 3413 Sugar Maple Ct
- 3407 Evergreen Dr
Your Personal Tour Guide
Ask me questions while you tour the home.