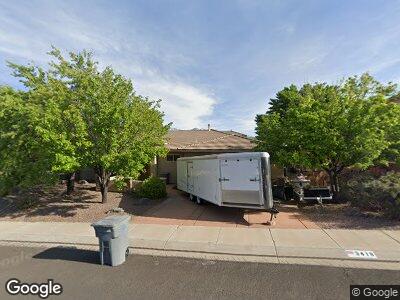
3418 W 400 N Hurricane, UT 84737
Estimated Value: $479,000 - $565,000
4
Beds
2
Baths
1,904
Sq Ft
$271/Sq Ft
Est. Value
About This Home
This home is located at 3418 W 400 N, Hurricane, UT 84737 and is currently estimated at $515,296, approximately $270 per square foot. 3418 W 400 N is a home located in Washington County with nearby schools including Hurricane Middle School, Hurricane High School, and Hurricane Intermediate School.
Ownership History
Date
Name
Owned For
Owner Type
Purchase Details
Closed on
Jun 22, 2009
Sold by
Carter Melvin R
Bought by
Carter Quinn
Current Estimated Value
Home Financials for this Owner
Home Financials are based on the most recent Mortgage that was taken out on this home.
Original Mortgage
$176,000
Outstanding Balance
$113,450
Interest Rate
4.83%
Mortgage Type
New Conventional
Estimated Equity
$401,846
Purchase Details
Closed on
Dec 1, 2008
Sold by
Pm Dev Corp
Bought by
Carter Melvin R
Home Financials for this Owner
Home Financials are based on the most recent Mortgage that was taken out on this home.
Original Mortgage
$140,441
Interest Rate
6.47%
Mortgage Type
Purchase Money Mortgage
Purchase Details
Closed on
May 12, 2006
Sold by
Stratton Brothers
Bought by
Pm Dev Corp
Create a Home Valuation Report for This Property
The Home Valuation Report is an in-depth analysis detailing your home's value as well as a comparison with similar homes in the area
Home Values in the Area
Average Home Value in this Area
Purchase History
| Date | Buyer | Sale Price | Title Company |
|---|---|---|---|
| Carter Quinn | -- | Equity Title | |
| Carter Melvin R | -- | Southern Utah Title | |
| Pm Dev Corp | -- | Southern Utah Title Co |
Source: Public Records
Mortgage History
| Date | Status | Borrower | Loan Amount |
|---|---|---|---|
| Open | Carter Quinn | $176,000 | |
| Closed | Carter Melvin R | $140,441 |
Source: Public Records
Tax History Compared to Growth
Tax History
| Year | Tax Paid | Tax Assessment Tax Assessment Total Assessment is a certain percentage of the fair market value that is determined by local assessors to be the total taxable value of land and additions on the property. | Land | Improvement |
|---|---|---|---|---|
| 2023 | $3,621 | $485,700 | $115,000 | $370,700 |
| 2022 | $3,638 | $457,500 | $95,000 | $362,500 |
| 2021 | $3,337 | $341,100 | $65,000 | $276,100 |
| 2020 | $3,246 | $310,200 | $60,000 | $250,200 |
| 2019 | $3,174 | $294,200 | $60,000 | $234,200 |
| 2018 | $3,068 | $265,900 | $0 | $0 |
| 2017 | $2,905 | $242,200 | $0 | $0 |
| 2016 | $2,736 | $221,000 | $0 | $0 |
| 2015 | $2,751 | $214,000 | $0 | $0 |
| 2014 | $2,406 | $194,700 | $0 | $0 |
Source: Public Records
Map
Nearby Homes