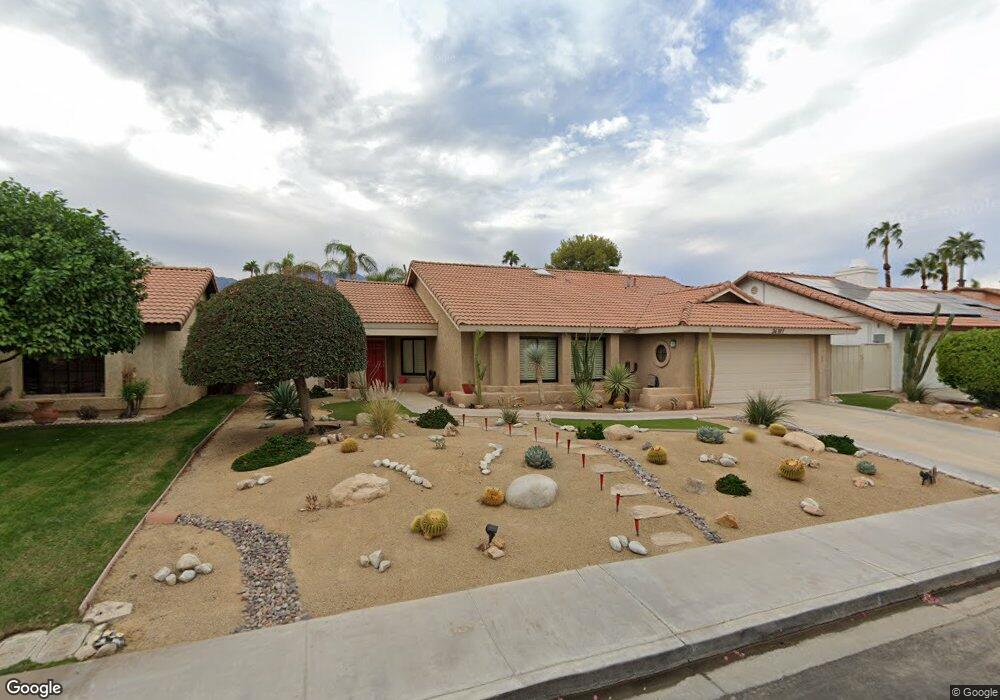
34181 Suncrest Dr Cathedral City, CA 92234
Aqua Caliente South NeighborhoodEstimated Value: $413,000 - $582,000
3
Beds
2
Baths
1,555
Sq Ft
$309/Sq Ft
Est. Value
About This Home
This home is located at 34181 Suncrest Dr, Cathedral City, CA 92234 and is currently estimated at $481,183, approximately $309 per square foot. 34181 Suncrest Dr is a home located in Riverside County with nearby schools including Cathedral City Elementary School, Nellie N. Coffman Middle School, and Cathedral City High School.
Ownership History
Date
Name
Owned For
Owner Type
Purchase Details
Closed on
Jul 18, 2001
Sold by
Mclaughlin Jill and Rike Patricia A
Bought by
Mullaney Donna M
Current Estimated Value
Purchase Details
Closed on
Jul 30, 1999
Sold by
Andersen Stacy M
Bought by
Mclaughlin Jill and Rike Patricia A
Purchase Details
Closed on
Jun 30, 1998
Sold by
Moore Kristin M
Bought by
Andersen Stacy M
Home Financials for this Owner
Home Financials are based on the most recent Mortgage that was taken out on this home.
Original Mortgage
$101,000
Interest Rate
6.95%
Mortgage Type
Purchase Money Mortgage
Purchase Details
Closed on
May 31, 1995
Sold by
Corley Suber D and Martinez Ronald P
Bought by
Andersen Stacy M and Moore Kristin M
Home Financials for this Owner
Home Financials are based on the most recent Mortgage that was taken out on this home.
Original Mortgage
$98,800
Interest Rate
8.36%
Mortgage Type
Purchase Money Mortgage
Create a Home Valuation Report for This Property
The Home Valuation Report is an in-depth analysis detailing your home's value as well as a comparison with similar homes in the area
Home Values in the Area
Average Home Value in this Area
Purchase History
| Date | Buyer | Sale Price | Title Company |
|---|---|---|---|
| Mullaney Donna M | -- | First American Title Ins Co | |
| Mclaughlin Jill | $135,000 | -- | |
| Andersen Stacy M | -- | Fidelity National Title Ins | |
| Andersen Stacy M | $123,500 | First American Title Ins Co |
Source: Public Records
Mortgage History
| Date | Status | Borrower | Loan Amount |
|---|---|---|---|
| Previous Owner | Andersen Stacy M | $101,000 | |
| Previous Owner | Andersen Stacy M | $98,800 |
Source: Public Records
Tax History Compared to Growth
Tax History
| Year | Tax Paid | Tax Assessment Tax Assessment Total Assessment is a certain percentage of the fair market value that is determined by local assessors to be the total taxable value of land and additions on the property. | Land | Improvement |
|---|---|---|---|---|
| 2025 | $3,225 | $207,463 | $19,967 | $187,496 |
| 2024 | $3,225 | $203,396 | $19,576 | $183,820 |
| 2023 | $3,225 | $199,409 | $19,193 | $180,216 |
| 2022 | $3,094 | $195,500 | $18,817 | $176,683 |
| 2021 | $2,987 | $191,668 | $18,449 | $173,219 |
| 2020 | $2,836 | $189,703 | $18,260 | $171,443 |
| 2019 | $2,775 | $185,984 | $17,902 | $168,082 |
| 2018 | $2,706 | $182,338 | $17,551 | $164,787 |
| 2017 | $2,657 | $178,763 | $17,207 | $161,556 |
| 2016 | $2,581 | $175,259 | $16,870 | $158,389 |
| 2015 | $2,492 | $172,628 | $16,617 | $156,011 |
| 2014 | $2,470 | $169,249 | $16,293 | $152,956 |
Source: Public Records
Map
Nearby Homes
- 34061 Plumley Rd
- 34354 Laura Way
- 105 Shoreline Dr
- 34071 Denise Way
- 34341 Denise Way
- 34090 Denise Way
- 7 Lake Como Ct
- 64 Via Santo Tomas
- 35070 Maria Rd
- 69360 Vera Dr
- 65 Shoreline Dr
- 5 Lake Louise Ct
- 497 Prairie
- 8 Via Santa Ramona
- 69727 Camino Pacifico
- 392 Standing Bear
- 37 Shoreline Dr
- 24 Mesa View Dr
- 40 Shoreline Dr
- 69295 Nilda Dr
- 34155 Suncrest Dr
- 34211 Suncrest Dr
- 34220 Linda Way
- 34240 Linda Way
- 34127 Suncrest Dr
- 34237 Suncrest Dr
- 34200 Linda Way
- 34260 Linda Way
- 69442 Bion Way
- 69443 Bion Way
- 34180 Linda Way
- 34280 Linda Way
- 34099 Suncrest Dr
- 34263 Suncrest Dr
- 69454 Bion Way
- 34030 Suncrest Dr
- 69455 Bion Way
- 69438 Ashley Ct
- 34160 Linda Way
- 34300 Linda Way