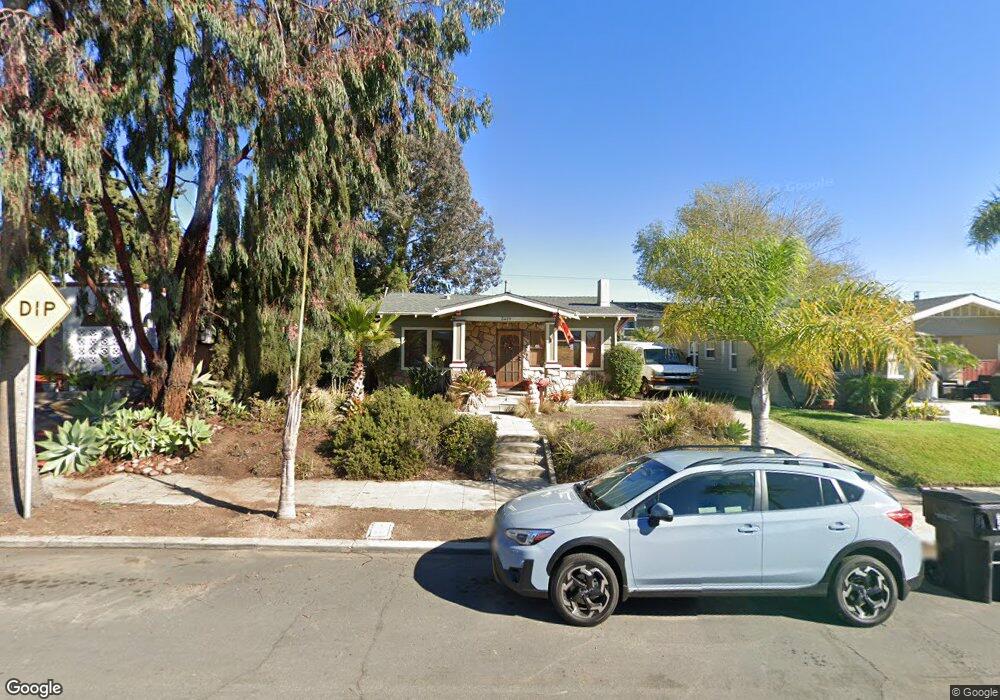
3419 Bancroft St San Diego, CA 92104
North Park NeighborhoodEstimated Value: $948,000 - $1,276,000
2
Beds
1
Bath
942
Sq Ft
$1,146/Sq Ft
Est. Value
About This Home
This home is located at 3419 Bancroft St, San Diego, CA 92104 and is currently estimated at $1,079,983, approximately $1,146 per square foot. 3419 Bancroft St is a home located in San Diego County with nearby schools including McKinley Elementary School, Roosevelt International Middle School, and St. Patrick's School.
Ownership History
Date
Name
Owned For
Owner Type
Purchase Details
Closed on
Nov 15, 2011
Sold by
Casarda Alice and Carsada Alice
Bought by
Casarda Alice and Snover Richard
Current Estimated Value
Home Financials for this Owner
Home Financials are based on the most recent Mortgage that was taken out on this home.
Original Mortgage
$89,000
Interest Rate
4.09%
Mortgage Type
New Conventional
Purchase Details
Closed on
Mar 28, 1995
Sold by
Develacor Inc
Bought by
Casarda Alice
Home Financials for this Owner
Home Financials are based on the most recent Mortgage that was taken out on this home.
Original Mortgage
$142,180
Interest Rate
8.5%
Purchase Details
Closed on
Aug 2, 1994
Sold by
Pringle Mina M and Pringle Minah M
Bought by
Develacor Inc
Home Financials for this Owner
Home Financials are based on the most recent Mortgage that was taken out on this home.
Original Mortgage
$87,000
Interest Rate
8.65%
Create a Home Valuation Report for This Property
The Home Valuation Report is an in-depth analysis detailing your home's value as well as a comparison with similar homes in the area
Home Values in the Area
Average Home Value in this Area
Purchase History
| Date | Buyer | Sale Price | Title Company |
|---|---|---|---|
| Casarda Alice | -- | Stewart Title Of California | |
| Casarda Alice | $158,000 | Gateway Title Company | |
| Develacor Inc | $97,000 | Gateway Title Company |
Source: Public Records
Mortgage History
| Date | Status | Borrower | Loan Amount |
|---|---|---|---|
| Closed | Casarda Alice | $89,000 | |
| Closed | Casarda Alice | $142,180 | |
| Previous Owner | Develacor Inc | $87,000 |
Source: Public Records
Tax History Compared to Growth
Tax History
| Year | Tax Paid | Tax Assessment Tax Assessment Total Assessment is a certain percentage of the fair market value that is determined by local assessors to be the total taxable value of land and additions on the property. | Land | Improvement |
|---|---|---|---|---|
| 2025 | $3,176 | $265,362 | $149,744 | $115,618 |
| 2024 | $3,176 | $260,159 | $146,808 | $113,351 |
| 2023 | $3,103 | $255,059 | $143,930 | $111,129 |
| 2022 | $3,018 | $250,058 | $141,108 | $108,950 |
| 2021 | $2,994 | $245,156 | $138,342 | $106,814 |
| 2020 | $2,957 | $242,643 | $136,924 | $105,719 |
| 2019 | $2,903 | $237,887 | $134,240 | $103,647 |
| 2018 | $2,714 | $233,223 | $131,608 | $101,615 |
| 2017 | $80 | $228,651 | $129,028 | $99,623 |
| 2016 | $2,603 | $224,169 | $126,499 | $97,670 |
| 2015 | $2,564 | $220,802 | $124,599 | $96,203 |
| 2014 | $2,523 | $216,478 | $122,159 | $94,319 |
Source: Public Records
Map
Nearby Homes
- 3388 Bancroft St
- 3509-11 32nd St
- 3572 33rd St
- 3322 Nile St
- 3365-69 Grim Ave
- 3209-13 31st St
- 0 Boundary St Unit SB25155904
- 3410 Grim Ave
- 0 35th St
- 3694 33rd St
- 3129 Redwood St
- 3167 Landis St
- 3515 Vancouver Ave
- 3421 Vancouver Ave
- 3376 30th St
- 2929 32nd St
- 3143-47 30th St
- 3078 Quince St
- 3780 32nd St
- 3739 31st St
- 3413 Bancroft St
- 3425-27 Bancroft St
- 3425 Bancroft St Unit 27
- 3409 Bancroft St
- 3435 Bancroft St
- 3254 Upas St
- 3265 Myrtle Ave
- 3420 33rd St Unit 22
- 3274 Upas St
- 3430 33rd St
- 3412 33rd St
- 3443 Bancroft St
- 3418 Bancroft St Unit 20
- 3277 Myrtle Ave
- 3387 Bancroft St
- 3271 Upas St
- 3406 33rd St
- 3424 Bancroft St
- 3412 Bancroft St
- 3432 Bancroft St